

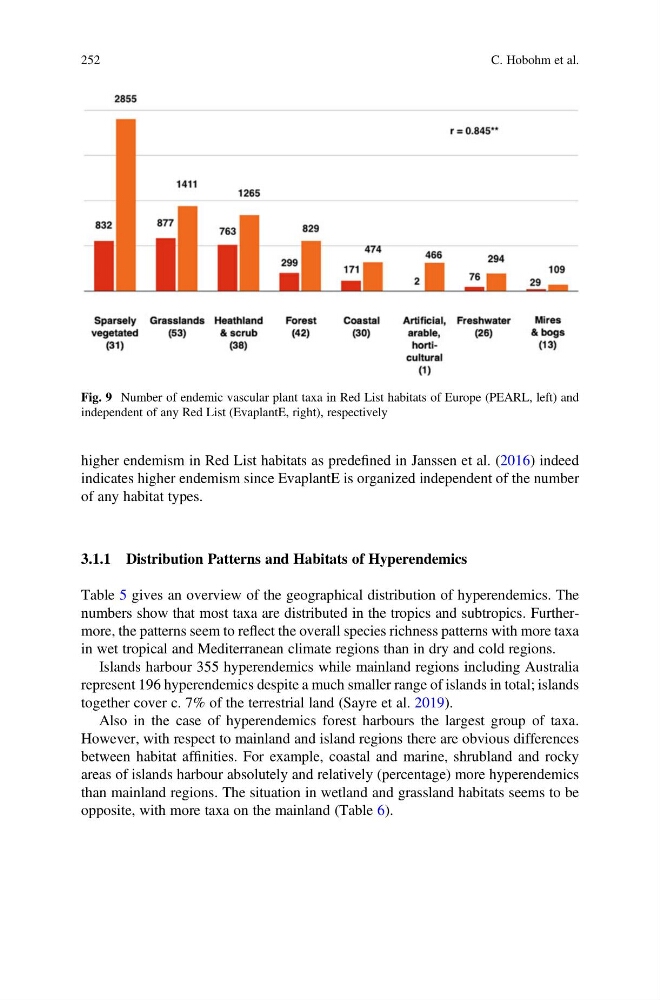
higher endemism in Red List habitats as predefined in Janssen et al. (2016) indeed
indicates higher endemism since EvaplantE is organized independent of the number
of any habitat types.
3.1.1 Distribution Patterns and Habitats of Hyperendemics
Table 5 gives an overview of the geographical distribution of hyperendemics. The
numbers show that most taxa are distributed in the tropics and subtropics. Furthermore, the patterns seem to reflect the overall species richness patterns with more taxa
in wet tropical and Mediterranean climate regions than in dry and cold regions.
Islands harbour 355 hyperendemics while mainland regions including Australia
represent 196 hyperendemics despite a much smaller range of islands in total; islands
together cover c. 7% of the terrestrial land (Sayre et al. 2019).
Also in the case of hyperendemics forest harbours the largest group of taxa.
However, with respect to mainland and island regions there are obvious differences
between habitat affinities. For example, coastal and marine, shrubland and rocky
areas of islands harbour absolutely and relatively (percentage) more hyperendemics
than mainland regions. The situation in wetland and grassland habitats seems to be
opposite, with more taxa on the mainland (Table 6).
Fig. 9 Number of endemic vascular plant taxa in Red List habitats of Europe (PEARL, left) and
independent of any Red List (EvaplantE, right), respectively
252
C. Hobohm et al.
indicates higher endemism since EvaplantE is organized independent of the number
of any habitat types.
3.1.1 Distribution Patterns and Habitats of Hyperendemics
Table 5 gives an overview of the geographical distribution of hyperendemics. The
numbers show that most taxa are distributed in the tropics and subtropics. Furthermore, the patterns seem to reflect the overall species richness patterns with more taxa
in wet tropical and Mediterranean climate regions than in dry and cold regions.
Islands harbour 355 hyperendemics while mainland regions including Australia
represent 196 hyperendemics despite a much smaller range of islands in total; islands
together cover c. 7% of the terrestrial land (Sayre et al. 2019).
Also in the case of hyperendemics forest harbours the largest group of taxa.
However, with respect to mainland and island regions there are obvious differences
between habitat affinities. For example, coastal and marine, shrubland and rocky
areas of islands harbour absolutely and relatively (percentage) more hyperendemics
than mainland regions. The situation in wetland and grassland habitats seems to be
opposite, with more taxa on the mainland (Table 6).
Fig. 9 Number of endemic vascular plant taxa in Red List habitats of Europe (PEARL, left) and
independent of any Red List (EvaplantE, right), respectively
252
C. Hobohm et al.