

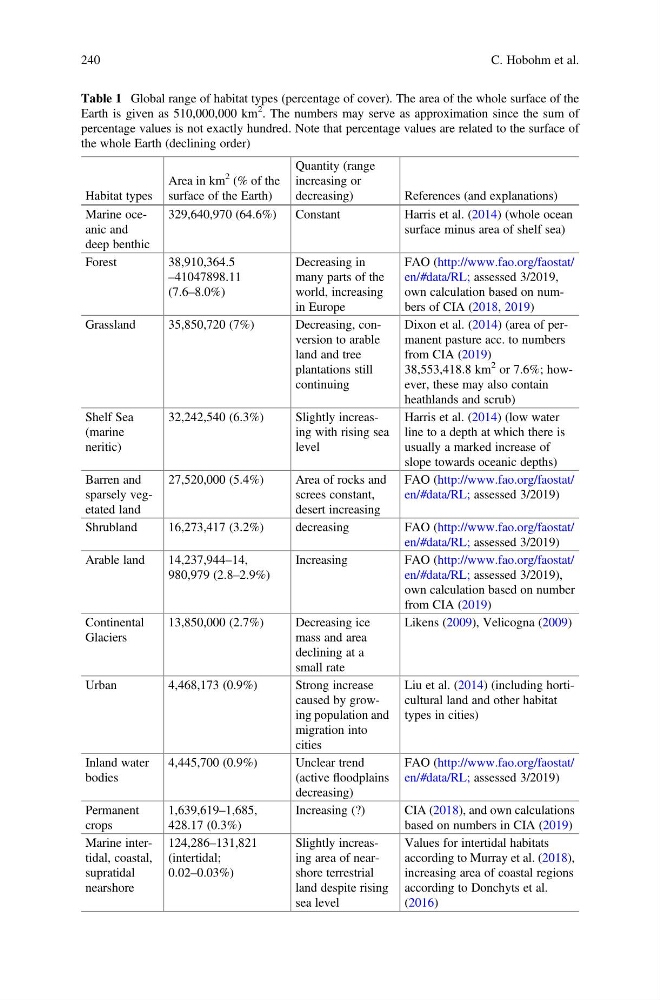
Table 1 Global range of habitat types (percentage of cover). The area of the whole surface of the
Earth is given as 510,000,000 km
2
. The numbers may serve as approximation since the sum of
percentage values is not exactly hundred. Note that percentage values are related to the surface of
the whole Earth (declining order)
Habitat types
Area in km
2 (% of the
surface of the Earth)
Quantity (range
increasing or
decreasing)
References (and explanations)
Marine oceanic and
deep benthic
329,640,970 (64.6%) Constant
Harris et al. (2014) (whole ocean
surface minus area of shelf sea)
Forest
38,910,364.5
–41047898.11
(7.6–8.0%)
Decreasing in
many parts of the
world, increasing
in Europe
FAO (http://www.fao.org/faostat/
en/#data/RL; assessed 3/2019,
own calculation based on numbers of CIA (2018, 2019)
Grassland
35,850,720 (7%)
Decreasing, conversion to arable
land and tree
plantations still
continuing
Dixon et al. (2014) (area of permanent pasture acc. to numbers
from CIA (2019)
38,553,418.8 km
2 or 7.6%; however, these may also contain
heathlands and scrub)
Shelf Sea
(marine
neritic)
32,242,540 (6.3%)
Slightly increasing with rising sea
level
Harris et al. (2014) (low water
line to a depth at which there is
usually a marked increase of
slope towards oceanic depths)
Barren and
sparsely vegetated land
27,520,000 (5.4%)
Area of rocks and
screes constant,
desert increasing
FAO (http://www.fao.org/faostat/
en/#data/RL; assessed 3/2019)
Shrubland
16,273,417 (3.2%)
decreasing
FAO (http://www.fao.org/faostat/
en/#data/RL; assessed 3/2019)
Arable land
14,237,944–14,
980,979 (2.8–2.9%)
Increasing
FAO (http://www.fao.org/faostat/
en/#data/RL; assessed 3/2019),
own calculation based on number
from CIA (2019)
Continental
Glaciers
13,850,000 (2.7%)
Decreasing ice
mass and area
declining at a
small rate
Likens (2009), Velicogna (2009)
Urban
4,468,173 (0.9%)
Strong increase
caused by growing population and
migration into
cities
Liu et al. (2014) (including horticultural land and other habitat
types in cities)
Inland water
bodies
4,445,700 (0.9%)
Unclear trend
(active floodplains
decreasing)
FAO (http://www.fao.org/faostat/
en/#data/RL; assessed 3/2019)
Permanent
crops
1,639,619–1,685,
428.17 (0.3%)
Increasing (?)
CIA (2018), and own calculations
based on numbers in CIA (2019)
Marine intertidal, coastal,
supratidal
nearshore
124,286–131,821
(intertidal;
0.02–0.03%)
Slightly increasing area of nearshore terrestrial
land despite rising
sea level
Values for intertidal habitats
according to Murray et al. (2018),
increasing area of coastal regions
according to Donchyts et al.
(2016)
240
C. Hobohm et al.
Earth is given as 510,000,000 km
2
. The numbers may serve as approximation since the sum of
percentage values is not exactly hundred. Note that percentage values are related to the surface of
the whole Earth (declining order)
Habitat types
Area in km
2 (% of the
surface of the Earth)
Quantity (range
increasing or
decreasing)
References (and explanations)
Marine oceanic and
deep benthic
329,640,970 (64.6%) Constant
Harris et al. (2014) (whole ocean
surface minus area of shelf sea)
Forest
38,910,364.5
–41047898.11
(7.6–8.0%)
Decreasing in
many parts of the
world, increasing
in Europe
FAO (http://www.fao.org/faostat/
en/#data/RL; assessed 3/2019,
own calculation based on numbers of CIA (2018, 2019)
Grassland
35,850,720 (7%)
Decreasing, conversion to arable
land and tree
plantations still
continuing
Dixon et al. (2014) (area of permanent pasture acc. to numbers
from CIA (2019)
38,553,418.8 km
2 or 7.6%; however, these may also contain
heathlands and scrub)
Shelf Sea
(marine
neritic)
32,242,540 (6.3%)
Slightly increasing with rising sea
level
Harris et al. (2014) (low water
line to a depth at which there is
usually a marked increase of
slope towards oceanic depths)
Barren and
sparsely vegetated land
27,520,000 (5.4%)
Area of rocks and
screes constant,
desert increasing
FAO (http://www.fao.org/faostat/
en/#data/RL; assessed 3/2019)
Shrubland
16,273,417 (3.2%)
decreasing
FAO (http://www.fao.org/faostat/
en/#data/RL; assessed 3/2019)
Arable land
14,237,944–14,
980,979 (2.8–2.9%)
Increasing
FAO (http://www.fao.org/faostat/
en/#data/RL; assessed 3/2019),
own calculation based on number
from CIA (2019)
Continental
Glaciers
13,850,000 (2.7%)
Decreasing ice
mass and area
declining at a
small rate
Likens (2009), Velicogna (2009)
Urban
4,468,173 (0.9%)
Strong increase
caused by growing population and
migration into
cities
Liu et al. (2014) (including horticultural land and other habitat
types in cities)
Inland water
bodies
4,445,700 (0.9%)
Unclear trend
(active floodplains
decreasing)
FAO (http://www.fao.org/faostat/
en/#data/RL; assessed 3/2019)
Permanent
crops
1,639,619–1,685,
428.17 (0.3%)
Increasing (?)
CIA (2018), and own calculations
based on numbers in CIA (2019)
Marine intertidal, coastal,
supratidal
nearshore
124,286–131,821
(intertidal;
0.02–0.03%)
Slightly increasing area of nearshore terrestrial
land despite rising
sea level
Values for intertidal habitats
according to Murray et al. (2018),
increasing area of coastal regions
according to Donchyts et al.
(2016)
240
C. Hobohm et al.