

et al. 2019). In general, most relationships are significant positive while a unimodal
or U-shaped curve (Kuznets Hypothesis) often has not been confirmed.
This might have to do with the fact that the terminology of pre-industrial,
agrarian, industrial and service economy is related to the numbers of workers or
the amount of money of GDP by sector. However, the influences on the environment
and landscapes obviously do not follow this sequence. The impact of industrial
agriculture on the environment is, despite a shutdown of farms and a decreasing
number of persons working in this sector in so-called developed countries,
extremely high.
Hoffmann (2004) calculated the impact of environmental and economic influences on the number of threatened mammal and bird species. He also used crossnational data (N ¼ 120). However, because of different predictors the models of
Hoffmann’s and our analyses are not directly comparable. Nevertheless, Hoffmann
found that the endangerment of the species in peripheral nations are affected by GDP
growth, whereas rates in semiperipheral nations are affected more by GDP per
capita. Furthermore he also found an influence of other environmental factors.
Mikkelson (2013) concluded that growth is the problem and equality might be the
solution. Our results confirm the conclusion of Mikkelsen. Economic growth is the
problem. However, equality might theoretically be part of the solution.
The variables that we have used represent numbers indicating growth of national
economies, income, inequality within countries, national floras and faunas, countryendemics and critically endangered species which still live in the countries.
Independent of processes and conditions within countries, countries are
connected by international legal and illegal trade across borders, sometimes over
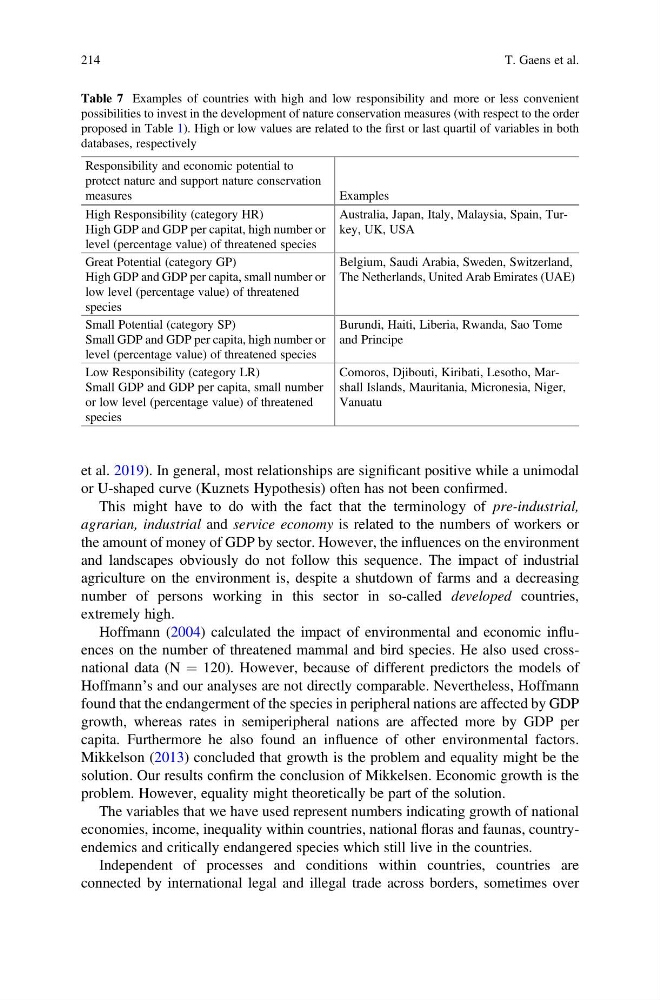
Table 7 Examples of countries with high and low responsibility and more or less convenient
possibilities to invest in the development of nature conservation measures (with respect to the order
proposed in Table 1). High or low values are related to the first or last quartil of variables in both
databases, respectively
Responsibility and economic potential to
protect nature and support nature conservation
measures
Examples
High Responsibility (category HR)
High GDP and GDP per capitat, high number or
level (percentage value) of threatened species
Australia, Japan, Italy, Malaysia, Spain, Turkey, UK, USA
Great Potential (category GP)
High GDP and GDP per capita, small number or
low level (percentage value) of threatened
species
Belgium, Saudi Arabia, Sweden, Switzerland,
The Netherlands, United Arab Emirates (UAE)
Small Potential (category SP)
Small GDP and GDP per capita, high number or
level (percentage value) of threatened species
Burundi, Haiti, Liberia, Rwanda, Sao Tome
and Principe
Low Responsibility (category LR)
Small GDP and GDP per capita, small number
or low level (percentage value) of threatened
species
Comoros, Djibouti, Kiribati, Lesotho, Marshall Islands, Mauritania, Micronesia, Niger,
Vanuatu
214
T. Gaens et al.
or U-shaped curve (Kuznets Hypothesis) often has not been confirmed.
This might have to do with the fact that the terminology of pre-industrial,
agrarian, industrial and service economy is related to the numbers of workers or
the amount of money of GDP by sector. However, the influences on the environment
and landscapes obviously do not follow this sequence. The impact of industrial
agriculture on the environment is, despite a shutdown of farms and a decreasing
number of persons working in this sector in so-called developed countries,
extremely high.
Hoffmann (2004) calculated the impact of environmental and economic influences on the number of threatened mammal and bird species. He also used crossnational data (N ¼ 120). However, because of different predictors the models of
Hoffmann’s and our analyses are not directly comparable. Nevertheless, Hoffmann
found that the endangerment of the species in peripheral nations are affected by GDP
growth, whereas rates in semiperipheral nations are affected more by GDP per
capita. Furthermore he also found an influence of other environmental factors.
Mikkelson (2013) concluded that growth is the problem and equality might be the
solution. Our results confirm the conclusion of Mikkelsen. Economic growth is the
problem. However, equality might theoretically be part of the solution.
The variables that we have used represent numbers indicating growth of national
economies, income, inequality within countries, national floras and faunas, countryendemics and critically endangered species which still live in the countries.
Independent of processes and conditions within countries, countries are
connected by international legal and illegal trade across borders, sometimes over
Table 7 Examples of countries with high and low responsibility and more or less convenient
possibilities to invest in the development of nature conservation measures (with respect to the order
proposed in Table 1). High or low values are related to the first or last quartil of variables in both
databases, respectively
Responsibility and economic potential to
protect nature and support nature conservation
measures
Examples
High Responsibility (category HR)
High GDP and GDP per capitat, high number or
level (percentage value) of threatened species
Australia, Japan, Italy, Malaysia, Spain, Turkey, UK, USA
Great Potential (category GP)
High GDP and GDP per capita, small number or
low level (percentage value) of threatened
species
Belgium, Saudi Arabia, Sweden, Switzerland,
The Netherlands, United Arab Emirates (UAE)
Small Potential (category SP)
Small GDP and GDP per capita, high number or
level (percentage value) of threatened species
Burundi, Haiti, Liberia, Rwanda, Sao Tome
and Principe
Low Responsibility (category LR)
Small GDP and GDP per capita, small number
or low level (percentage value) of threatened
species
Comoros, Djibouti, Kiribati, Lesotho, Marshall Islands, Mauritania, Micronesia, Niger,
Vanuatu
214
T. Gaens et al.