

species number and Endemics-Area Relationship (EAR) for the number of
endemics. Both principles have so often been varified in log-log space that the
relationship has been called Arrhenius law (cf. Hobohm 2014; Hobohm and
Müller-Benedict 2018; Hobohm et al. 2019). According to the results of the correlation analyses there is a strong and highly significant relationships between the area
and the whole number of vascular plant species (r ¼ 0.69), and endemic vertebrates
(r ¼ 0.44), and between plant richness and the number of all critically endangered
species of a country (r ¼ 0.698). But we have to interpret the coefficient of area
ceteris paribus. Thus, the same GDP and GDP/capita generated on a smaller area will
result in higher population density and therefore in higher pressure to biodiversity. A
smaller GDP per capita ceteris paribus means a larger population, thus indicates a
smaller population density.
To specify the importance of GDP, we also distinguished GDP sectors, i.e. GDP
agriculture, GDP industry and GDP services of all 188 countries. Furthermore, we
used land use parameters such as range of arable land, permanent crops, permanent
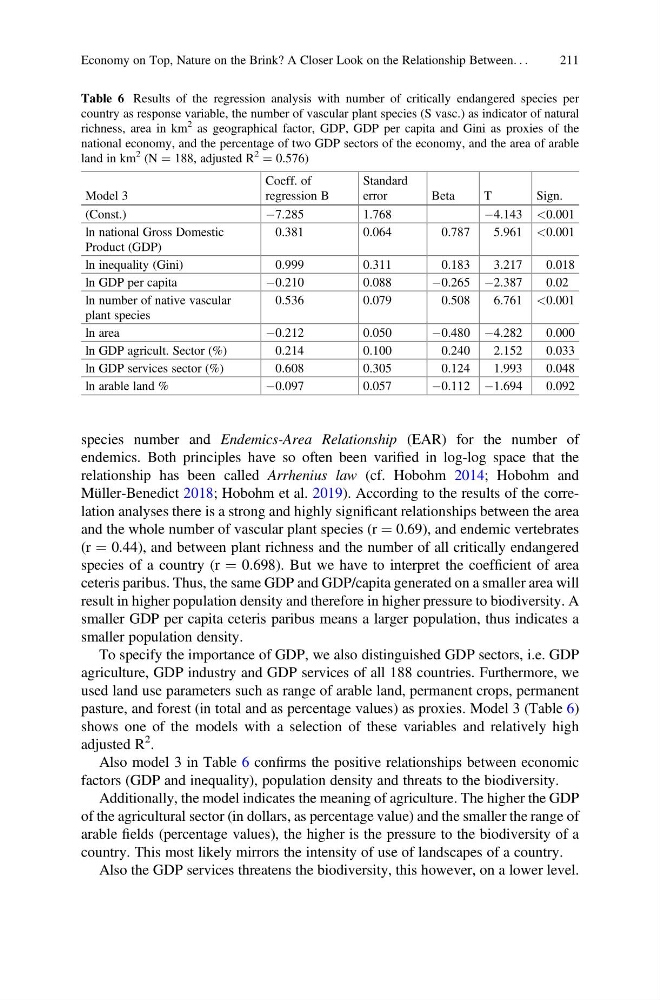
pasture, and forest (in total and as percentage values) as proxies. Model 3 (Table 6)
shows one of the models with a selection of these variables and relatively high
adjusted R
2 .
Also model 3 in Table 6 confirms the positive relationships between economic
factors (GDP and inequality), population density and threats to the biodiversity.
Additionally, the model indicates the meaning of agriculture. The higher the GDP
of the agricultural sector (in dollars, as percentage value) and the smaller the range of
arable fields (percentage values), the higher is the pressure to the biodiversity of a
country. This most likely mirrors the intensity of use of landscapes of a country.
Also the GDP services threatens the biodiversity, this however, on a lower level.
Table 6 Results of the regression analysis with number of critically endangered species per
country as response variable, the number of vascular plant species (S vasc.) as indicator of natural
richness, area in km
2 as geographical factor, GDP, GDP per capita and Gini as proxies of the
national economy, and the percentage of two GDP sectors of the economy, and the area of arable
land in km
2 (N ¼ 188, adjusted R
2 ¼ 0.576)
Model 3
Coeff. of
regression B
Standard
error
Beta
T
Sign.
(Const.)
À7.285
1.768
À4.143 <0.001
ln national Gross Domestic
Product (GDP)
0.381
0.064
0.787
5.961 <0.001
ln inequality (Gini)
0.999
0.311
0.183
3.217
0.018
ln GDP per capita
À0.210
0.088
À0.265 À2.387
0.02
ln number of native vascular
plant species
0.536
0.079
0.508
6.761 <0.001
ln area
À0.212
0.050
À0.480 À4.282
0.000
ln GDP agricult. Sector (%)
0.214
0.100
0.240
2.152
0.033
ln GDP services sector (%)
0.608
0.305
0.124
1.993
0.048
ln arable land %
À0.097
0.057
À0.112 À1.694
0.092
Economy on Top, Nature on the Brink? A Closer Look on the Relationship Between. . .
211
endemics. Both principles have so often been varified in log-log space that the
relationship has been called Arrhenius law (cf. Hobohm 2014; Hobohm and
Müller-Benedict 2018; Hobohm et al. 2019). According to the results of the correlation analyses there is a strong and highly significant relationships between the area
and the whole number of vascular plant species (r ¼ 0.69), and endemic vertebrates
(r ¼ 0.44), and between plant richness and the number of all critically endangered
species of a country (r ¼ 0.698). But we have to interpret the coefficient of area
ceteris paribus. Thus, the same GDP and GDP/capita generated on a smaller area will
result in higher population density and therefore in higher pressure to biodiversity. A
smaller GDP per capita ceteris paribus means a larger population, thus indicates a
smaller population density.
To specify the importance of GDP, we also distinguished GDP sectors, i.e. GDP
agriculture, GDP industry and GDP services of all 188 countries. Furthermore, we
used land use parameters such as range of arable land, permanent crops, permanent
pasture, and forest (in total and as percentage values) as proxies. Model 3 (Table 6)
shows one of the models with a selection of these variables and relatively high
adjusted R
2 .
Also model 3 in Table 6 confirms the positive relationships between economic
factors (GDP and inequality), population density and threats to the biodiversity.
Additionally, the model indicates the meaning of agriculture. The higher the GDP
of the agricultural sector (in dollars, as percentage value) and the smaller the range of
arable fields (percentage values), the higher is the pressure to the biodiversity of a
country. This most likely mirrors the intensity of use of landscapes of a country.
Also the GDP services threatens the biodiversity, this however, on a lower level.
Table 6 Results of the regression analysis with number of critically endangered species per
country as response variable, the number of vascular plant species (S vasc.) as indicator of natural
richness, area in km
2 as geographical factor, GDP, GDP per capita and Gini as proxies of the
national economy, and the percentage of two GDP sectors of the economy, and the area of arable
land in km
2 (N ¼ 188, adjusted R
2 ¼ 0.576)
Model 3
Coeff. of
regression B
Standard
error
Beta
T
Sign.
(Const.)
À7.285
1.768
À4.143 <0.001
ln national Gross Domestic
Product (GDP)
0.381
0.064
0.787
5.961 <0.001
ln inequality (Gini)
0.999
0.311
0.183
3.217
0.018
ln GDP per capita
À0.210
0.088
À0.265 À2.387
0.02
ln number of native vascular
plant species
0.536
0.079
0.508
6.761 <0.001
ln area
À0.212
0.050
À0.480 À4.282
0.000
ln GDP agricult. Sector (%)
0.214
0.100
0.240
2.152
0.033
ln GDP services sector (%)
0.608
0.305
0.124
1.993
0.048
ln arable land %
À0.097
0.057
À0.112 À1.694
0.092
Economy on Top, Nature on the Brink? A Closer Look on the Relationship Between. . .
211