

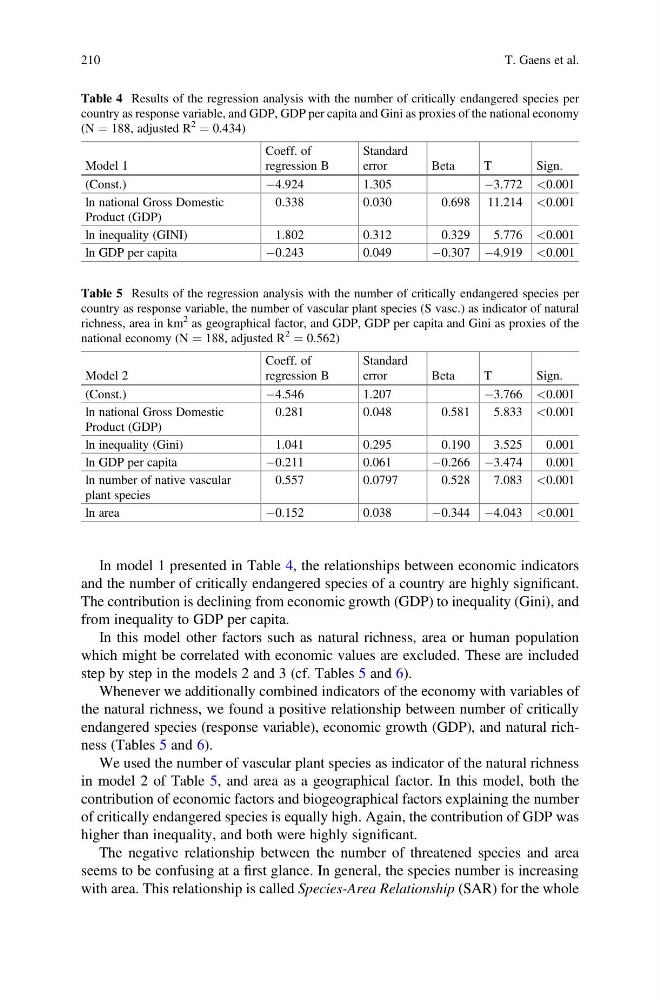
In model 1 presented in Table 4, the relationships between economic indicators
and the number of critically endangered species of a country are highly significant.
The contribution is declining from economic growth (GDP) to inequality (Gini), and
from inequality to GDP per capita.
In this model other factors such as natural richness, area or human population
which might be correlated with economic values are excluded. These are included
step by step in the models 2 and 3 (cf. Tables 5 and 6).
Whenever we additionally combined indicators of the economy with variables of
the natural richness, we found a positive relationship between number of critically
endangered species (response variable), economic growth (GDP), and natural richness (Tables 5 and 6).
We used the number of vascular plant species as indicator of the natural richness
in model 2 of Table 5, and area as a geographical factor. In this model, both the
contribution of economic factors and biogeographical factors explaining the number
of critically endangered species is equally high. Again, the contribution of GDP was
higher than inequality, and both were highly significant.
The negative relationship between the number of threatened species and area
seems to be confusing at a first glance. In general, the species number is increasing
with area. This relationship is called Species-Area Relationship (SAR) for the whole
Table 4 Results of the regression analysis with the number of critically endangered species per
country as response variable, and GDP, GDP per capita and Gini as proxies of the national economy
(N ¼ 188, adjusted R
2 ¼ 0.434)
Model 1
Coeff. of
regression B
Standard
error
Beta
T
Sign.
(Const.)
À4.924
1.305
À3.772 <0.001
ln national Gross Domestic
Product (GDP)
0.338
0.030
0.698 11.214 <0.001
ln inequality (GINI)
1.802
0.312
0.329
5.776 <0.001
ln GDP per capita
À0.243
0.049
À0.307 À4.919 <0.001
Table 5 Results of the regression analysis with the number of critically endangered species per
country as response variable, the number of vascular plant species (S vasc.) as indicator of natural
richness, area in km
2 as geographical factor, and GDP, GDP per capita and Gini as proxies of the
national economy (N ¼ 188, adjusted R
2 ¼ 0.562)
Model 2
Coeff. of
regression B
Standard
error
Beta
T
Sign.
(Const.)
À4.546
1.207
À3.766 <0.001
ln national Gross Domestic
Product (GDP)
0.281
0.048
0.581
5.833 <0.001
ln inequality (Gini)
1.041
0.295
0.190
3.525
0.001
ln GDP per capita
À0.211
0.061
À0.266 À3.474
0.001
ln number of native vascular
plant species
0.557
0.0797
0.528
7.083 <0.001
ln area
À0.152
0.038
À0.344 À4.043 <0.001
210
T. Gaens et al.
and the number of critically endangered species of a country are highly significant.
The contribution is declining from economic growth (GDP) to inequality (Gini), and
from inequality to GDP per capita.
In this model other factors such as natural richness, area or human population
which might be correlated with economic values are excluded. These are included
step by step in the models 2 and 3 (cf. Tables 5 and 6).
Whenever we additionally combined indicators of the economy with variables of
the natural richness, we found a positive relationship between number of critically
endangered species (response variable), economic growth (GDP), and natural richness (Tables 5 and 6).
We used the number of vascular plant species as indicator of the natural richness
in model 2 of Table 5, and area as a geographical factor. In this model, both the
contribution of economic factors and biogeographical factors explaining the number
of critically endangered species is equally high. Again, the contribution of GDP was
higher than inequality, and both were highly significant.
The negative relationship between the number of threatened species and area
seems to be confusing at a first glance. In general, the species number is increasing
with area. This relationship is called Species-Area Relationship (SAR) for the whole
Table 4 Results of the regression analysis with the number of critically endangered species per
country as response variable, and GDP, GDP per capita and Gini as proxies of the national economy
(N ¼ 188, adjusted R
2 ¼ 0.434)
Model 1
Coeff. of
regression B
Standard
error
Beta
T
Sign.
(Const.)
À4.924
1.305
À3.772 <0.001
ln national Gross Domestic
Product (GDP)
0.338
0.030
0.698 11.214 <0.001
ln inequality (GINI)
1.802
0.312
0.329
5.776 <0.001
ln GDP per capita
À0.243
0.049
À0.307 À4.919 <0.001
Table 5 Results of the regression analysis with the number of critically endangered species per
country as response variable, the number of vascular plant species (S vasc.) as indicator of natural
richness, area in km
2 as geographical factor, and GDP, GDP per capita and Gini as proxies of the
national economy (N ¼ 188, adjusted R
2 ¼ 0.562)
Model 2
Coeff. of
regression B
Standard
error
Beta
T
Sign.
(Const.)
À4.546
1.207
À3.766 <0.001
ln national Gross Domestic
Product (GDP)
0.281
0.048
0.581
5.833 <0.001
ln inequality (Gini)
1.041
0.295
0.190
3.525
0.001
ln GDP per capita
À0.211
0.061
À0.266 À3.474
0.001
ln number of native vascular
plant species
0.557
0.0797
0.528
7.083 <0.001
ln area
À0.152
0.038
À0.344 À4.043 <0.001
210
T. Gaens et al.