

sustainability indicators). The problem of combined indicators is that it is impossible
to reason back to the contribution of the original components.
Everybody is able to measure temperature with a thermometer. However, it is
more complex to integrate millions of measurements over space and time to get a
trend line indicating global warming. Even if we know much about the relationship
between human activities, greenhouse gases and air temperature, it seems to be
difficult to estimate the effects of climate change on ecosystems, since for this there
is no simple indicator available (IPCC 2014).
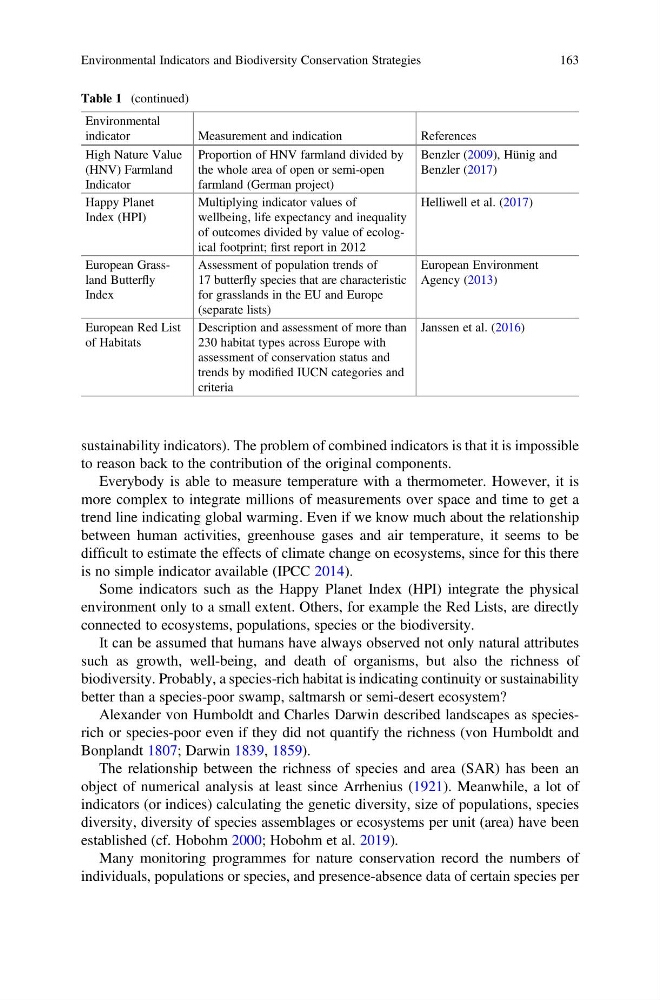
Some indicators such as the Happy Planet Index (HPI) integrate the physical
environment only to a small extent. Others, for example the Red Lists, are directly
connected to ecosystems, populations, species or the biodiversity.
It can be assumed that humans have always observed not only natural attributes
such as growth, well-being, and death of organisms, but also the richness of
biodiversity. Probably, a species-rich habitat is indicating continuity or sustainability
better than a species-poor swamp, saltmarsh or semi-desert ecosystem?
Alexander von Humboldt and Charles Darwin described landscapes as speciesrich or species-poor even if they did not quantify the richness (von Humboldt and
Bonplandt 1807; Darwin 1839, 1859).
The relationship between the richness of species and area (SAR) has been an
object of numerical analysis at least since Arrhenius (1921). Meanwhile, a lot of
indicators (or indices) calculating the genetic diversity, size of populations, species
diversity, diversity of species assemblages or ecosystems per unit (area) have been
established (cf. Hobohm 2000; Hobohm et al. 2019).
Many monitoring programmes for nature conservation record the numbers of
individuals, populations or species, and presence-absence data of certain species per
Table 1 (continued)
Environmental
indicator
Measurement and indication
References
High Nature Value
(HNV) Farmland
Indicator
Proportion of HNV farmland divided by
the whole area of open or semi-open
farmland (German project)
Benzler (2009), Hünig and
Benzler (2017)
Happy Planet
Index (HPI)
Multiplying indicator values of
wellbeing, life expectancy and inequality
of outcomes divided by value of ecological footprint; first report in 2012
Helliwell et al. (2017)
European Grassland Butterfly
Index
Assessment of population trends of
17 butterfly species that are characteristic
for grasslands in the EU and Europe
(separate lists)
European Environment
Agency (2013)
European Red List
of Habitats
Description and assessment of more than
230 habitat types across Europe with
assessment of conservation status and
trends by modified IUCN categories and
criteria
Janssen et al. (2016)
Environmental Indicators and Biodiversity Conservation Strategies
163
to reason back to the contribution of the original components.
Everybody is able to measure temperature with a thermometer. However, it is
more complex to integrate millions of measurements over space and time to get a
trend line indicating global warming. Even if we know much about the relationship
between human activities, greenhouse gases and air temperature, it seems to be
difficult to estimate the effects of climate change on ecosystems, since for this there
is no simple indicator available (IPCC 2014).
Some indicators such as the Happy Planet Index (HPI) integrate the physical
environment only to a small extent. Others, for example the Red Lists, are directly
connected to ecosystems, populations, species or the biodiversity.
It can be assumed that humans have always observed not only natural attributes
such as growth, well-being, and death of organisms, but also the richness of
biodiversity. Probably, a species-rich habitat is indicating continuity or sustainability
better than a species-poor swamp, saltmarsh or semi-desert ecosystem?
Alexander von Humboldt and Charles Darwin described landscapes as speciesrich or species-poor even if they did not quantify the richness (von Humboldt and
Bonplandt 1807; Darwin 1839, 1859).
The relationship between the richness of species and area (SAR) has been an
object of numerical analysis at least since Arrhenius (1921). Meanwhile, a lot of
indicators (or indices) calculating the genetic diversity, size of populations, species
diversity, diversity of species assemblages or ecosystems per unit (area) have been
established (cf. Hobohm 2000; Hobohm et al. 2019).
Many monitoring programmes for nature conservation record the numbers of
individuals, populations or species, and presence-absence data of certain species per
Table 1 (continued)
Environmental
indicator
Measurement and indication
References
High Nature Value
(HNV) Farmland
Indicator
Proportion of HNV farmland divided by
the whole area of open or semi-open
farmland (German project)
Benzler (2009), Hünig and
Benzler (2017)
Happy Planet
Index (HPI)
Multiplying indicator values of
wellbeing, life expectancy and inequality
of outcomes divided by value of ecological footprint; first report in 2012
Helliwell et al. (2017)
European Grassland Butterfly
Index
Assessment of population trends of
17 butterfly species that are characteristic
for grasslands in the EU and Europe
(separate lists)
European Environment
Agency (2013)
European Red List
of Habitats
Description and assessment of more than
230 habitat types across Europe with
assessment of conservation status and
trends by modified IUCN categories and
criteria
Janssen et al. (2016)
Environmental Indicators and Biodiversity Conservation Strategies
163