

70
J. Abe et al.
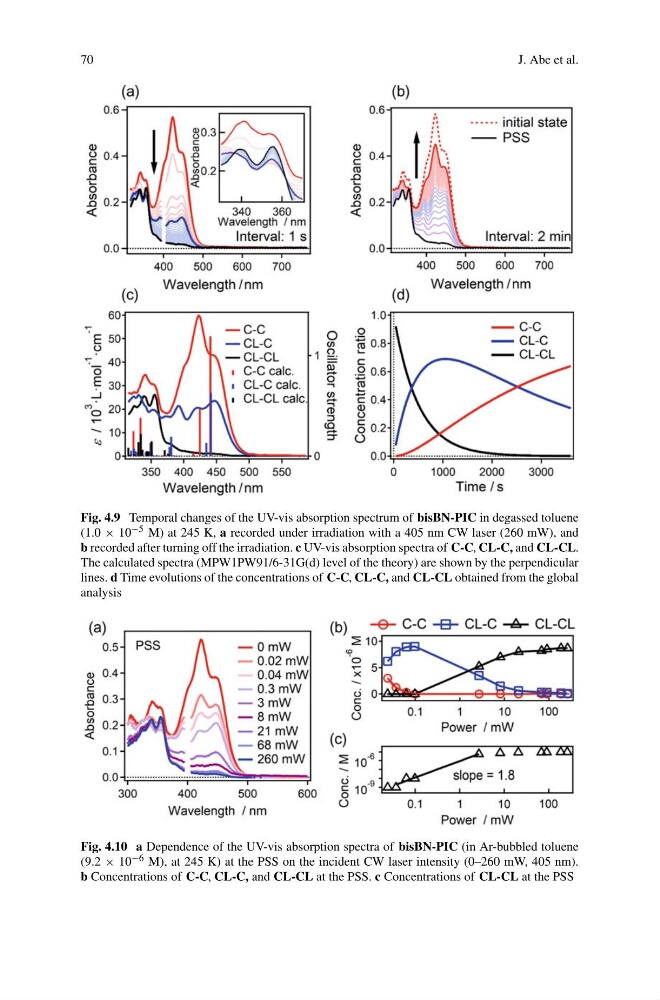
Fig. 4.9 Temporal changes of the UV-vis absorption spectrum of bisBN-PIC in degassed toluene
(1.0 × 10 −5 M) at 245 K, a recorded under irradiation with a 405 nm CW laser (260 mW), and
b recorded after turning off the irradiation. c UV-vis absorption spectra of C-C, CL-C, and CL-CL.
The calculated spectra (MPW1PW91/6-31G(d) level of the theory) are shown by the perpendicular
lines. d Time evolutions of the concentrations of C-C, CL-C, and CL-CL obtained from the global
analysis
Fig. 4.10 a Dependence of the UV-vis absorption spectra of bisBN-PIC (in Ar-bubbled toluene
(9.2 × 10 −6 M), at 245 K) at the PSS on the incident CW laser intensity (0–260 mW, 405 nm).
b Concentrations of C-C, CL-C, and CL-CL at the PSS. c Concentrations of CL-CL at the PSS
J. Abe et al.
Fig. 4.9 Temporal changes of the UV-vis absorption spectrum of bisBN-PIC in degassed toluene
(1.0 × 10 −5 M) at 245 K, a recorded under irradiation with a 405 nm CW laser (260 mW), and
b recorded after turning off the irradiation. c UV-vis absorption spectra of C-C, CL-C, and CL-CL.
The calculated spectra (MPW1PW91/6-31G(d) level of the theory) are shown by the perpendicular
lines. d Time evolutions of the concentrations of C-C, CL-C, and CL-CL obtained from the global
analysis
Fig. 4.10 a Dependence of the UV-vis absorption spectra of bisBN-PIC (in Ar-bubbled toluene
(9.2 × 10 −6 M), at 245 K) at the PSS on the incident CW laser intensity (0–260 mW, 405 nm).
b Concentrations of C-C, CL-C, and CL-CL at the PSS. c Concentrations of CL-CL at the PSS