

30 Single-Molecule Level Study and Control …
521
well as the average PL intensity changed significantly. Under a DC field (of +8 V
or +0.4 MV/cm) in the PMMA matrix, the intensity of nearly half of the particles
examined partially quenched to intermediate (GRAY) levels, with the remaining
particles irreversibly quenching to a background OFF level after a few seconds. An
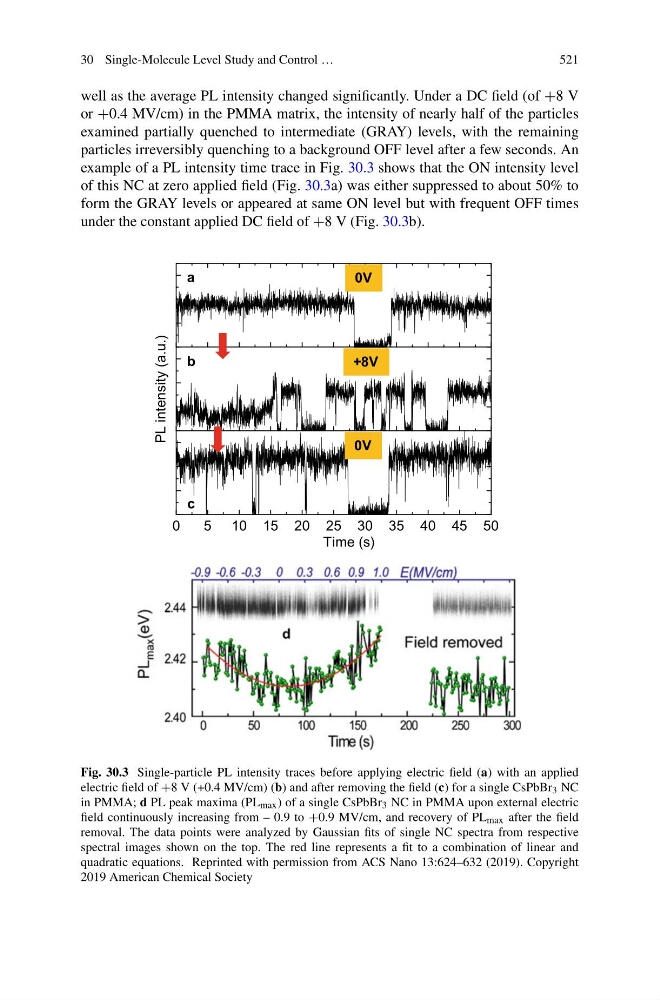
example of a PL intensity time trace in Fig. 30.3 shows that the ON intensity level
of this NC at zero applied field (Fig. 30.3a) was either suppressed to about 50% to
form the GRAY levels or appeared at same ON level but with frequent OFF times
under the constant applied DC field of +8 V (Fig. 30.3b).
0
10
20
30
0
10
20
30
0
5 10 15 20 25 30 35 40 45 50
0
10
20
30
8V
0 V
0V
Time (s)
+8V
0V
0V
PL intensity (a.u.)
a
b
c
Fig. 30.3 Single-particle PL intensity traces before applying electric field (a) with an applied
electric field of +8 V (+0.4 MV/cm) (b) and after removing the field (c) for a single CsPbBr 3 NC
in PMMA; d PL peak maxima (PL max ) of a single CsPbBr 3 NC in PMMA upon external electric
field continuously increasing from – 0.9 to +0.9 MV/cm, and recovery of PL max after the field
removal. The data points were analyzed by Gaussian fits of single NC spectra from respective
spectral images shown on the top. The red line represents a fit to a combination of linear and
quadratic equations. Reprinted with permission from ACS Nano 13:624–632 (2019). Copyright
2019 American Chemical Society
521
well as the average PL intensity changed significantly. Under a DC field (of +8 V
or +0.4 MV/cm) in the PMMA matrix, the intensity of nearly half of the particles
examined partially quenched to intermediate (GRAY) levels, with the remaining
particles irreversibly quenching to a background OFF level after a few seconds. An
example of a PL intensity time trace in Fig. 30.3 shows that the ON intensity level
of this NC at zero applied field (Fig. 30.3a) was either suppressed to about 50% to
form the GRAY levels or appeared at same ON level but with frequent OFF times
under the constant applied DC field of +8 V (Fig. 30.3b).
0
10
20
30
0
10
20
30
0
5 10 15 20 25 30 35 40 45 50
0
10
20
30
8V
0 V
0V
Time (s)
+8V
0V
0V
PL intensity (a.u.)
a
b
c
Fig. 30.3 Single-particle PL intensity traces before applying electric field (a) with an applied
electric field of +8 V (+0.4 MV/cm) (b) and after removing the field (c) for a single CsPbBr 3 NC
in PMMA; d PL peak maxima (PL max ) of a single CsPbBr 3 NC in PMMA upon external electric
field continuously increasing from – 0.9 to +0.9 MV/cm, and recovery of PL max after the field
removal. The data points were analyzed by Gaussian fits of single NC spectra from respective
spectral images shown on the top. The red line represents a fit to a combination of linear and
quadratic equations. Reprinted with permission from ACS Nano 13:624–632 (2019). Copyright
2019 American Chemical Society