

508
Y. Ishibashi and T. Asahi
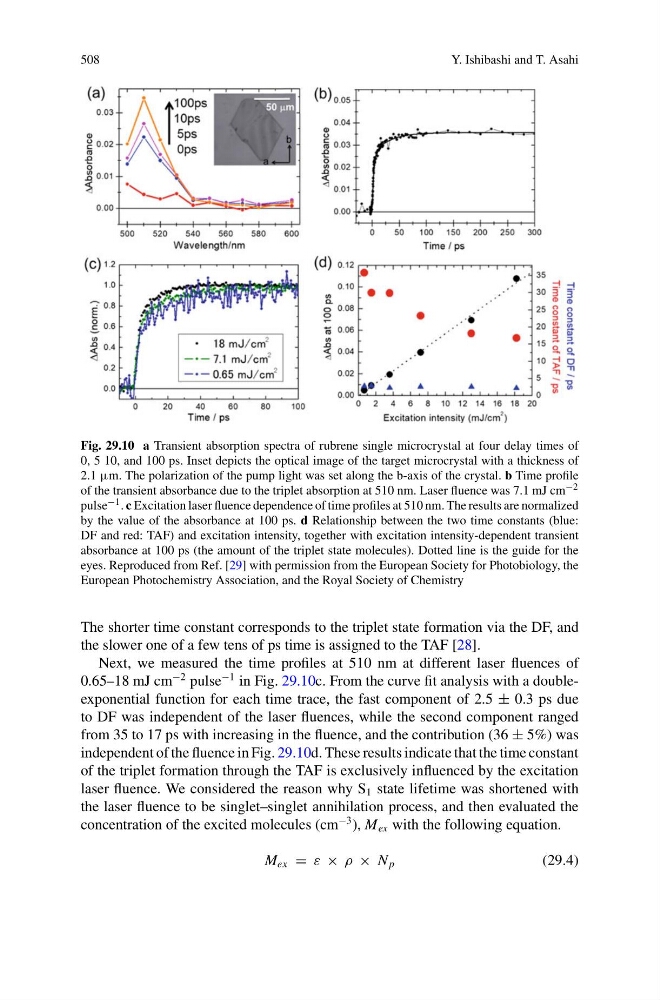
Fig. 29.10 a Transient absorption spectra of rubrene single microcrystal at four delay times of
0, 5 10, and 100 ps. Inset depicts the optical image of the target microcrystal with a thickness of
2.1 μm. The polarization of the pump light was set along the b-axis of the crystal. b Time profile
of the transient absorbance due to the triplet absorption at 510 nm. Laser fluence was 7.1 mJ cm −2
pulse −1 . c Excitation laser fluence dependence of time profiles at 510 nm. The results are normalized
by the value of the absorbance at 100 ps. d Relationship between the two time constants (blue:
DF and red: TAF) and excitation intensity, together with excitation intensity-dependent transient
absorbance at 100 ps (the amount of the triplet state molecules). Dotted line is the guide for the
eyes. Reproduced from Ref. [29] with permission from the European Society for Photobiology, the
European Photochemistry Association, and the Royal Society of Chemistry
The shorter time constant corresponds to the triplet state formation via the DF, and
the slower one of a few tens of ps time is assigned to the TAF [28].
Next, we measured the time profiles at 510 nm at different laser fluences of
0.65–18 mJ cm
−2 pulse
−1 in Fig. 29.10c. From the curve fit analysis with a doubleexponential function for each time trace, the fast component of 2.5 ± 0.3 ps due
to DF was independent of the laser fluences, while the second component ranged
from 35 to 17 ps with increasing in the fluence, and the contribution (36 ± 5%) was
independent of the fluence in Fig. 29.10d. These results indicate that the time constant
of the triplet formation through the TAF is exclusively influenced by the excitation
laser fluence. We considered the reason why S 1 state lifetime was shortened with
the laser fluence to be singlet–singlet annihilation process, and then evaluated the
concentration of the excited molecules (cm
−3 ), M ex with the following equation.
M ex = ε × ρ × N p
(29.4)
Y. Ishibashi and T. Asahi
Fig. 29.10 a Transient absorption spectra of rubrene single microcrystal at four delay times of
0, 5 10, and 100 ps. Inset depicts the optical image of the target microcrystal with a thickness of
2.1 μm. The polarization of the pump light was set along the b-axis of the crystal. b Time profile
of the transient absorbance due to the triplet absorption at 510 nm. Laser fluence was 7.1 mJ cm −2
pulse −1 . c Excitation laser fluence dependence of time profiles at 510 nm. The results are normalized
by the value of the absorbance at 100 ps. d Relationship between the two time constants (blue:
DF and red: TAF) and excitation intensity, together with excitation intensity-dependent transient
absorbance at 100 ps (the amount of the triplet state molecules). Dotted line is the guide for the
eyes. Reproduced from Ref. [29] with permission from the European Society for Photobiology, the
European Photochemistry Association, and the Royal Society of Chemistry
The shorter time constant corresponds to the triplet state formation via the DF, and
the slower one of a few tens of ps time is assigned to the TAF [28].
Next, we measured the time profiles at 510 nm at different laser fluences of
0.65–18 mJ cm
−2 pulse
−1 in Fig. 29.10c. From the curve fit analysis with a doubleexponential function for each time trace, the fast component of 2.5 ± 0.3 ps due
to DF was independent of the laser fluences, while the second component ranged
from 35 to 17 ps with increasing in the fluence, and the contribution (36 ± 5%) was
independent of the fluence in Fig. 29.10d. These results indicate that the time constant
of the triplet formation through the TAF is exclusively influenced by the excitation
laser fluence. We considered the reason why S 1 state lifetime was shortened with
the laser fluence to be singlet–singlet annihilation process, and then evaluated the
concentration of the excited molecules (cm
−3 ), M ex with the following equation.
M ex = ε × ρ × N p
(29.4)