

24 Biomimetic Functions by Microscopic Molecular Reactions …
407
S
S
Si
MeO
OMe
Si
F F F
F
F
F
Me
Me
Me
Me
Me
Me
S
S
OMe
MeO
Si
F
F
F
F
F
Si
Me
Me
Me
Me
Me
Me
1o
1c
UV
Vis.
(b)
(c)
0.0
0.2
0.4
0.6
0.8
1.0
0
20
40
60
80
100
120
140
160
[1c] / ([1o]+[1c])
Melting point /
o
C
1o:1c=78:22
(d)
(a)
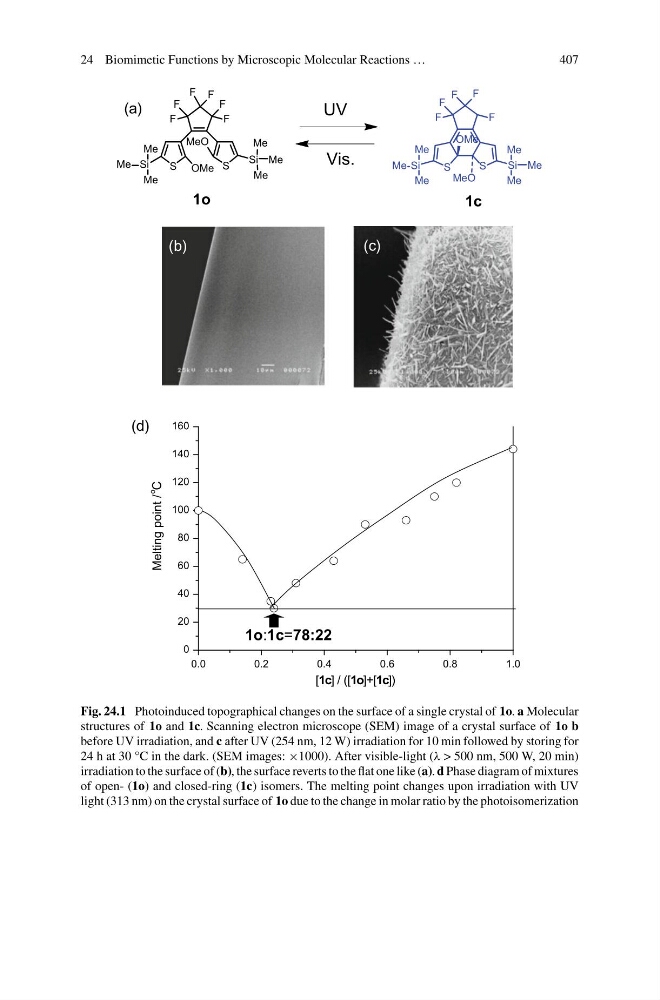
Fig. 24.1 Photoinduced topographical changes on the surface of a single crystal of 1o. a Molecular
structures of 1o and 1c. Scanning electron microscope (SEM) image of a crystal surface of 1o b
before UV irradiation, and c after UV (254 nm, 12 W) irradiation for 10 min followed by storing for
24 h at 30 °C in the dark. (SEM images: ×1000). After visible-light (λ > 500 nm, 500 W, 20 min)
irradiation to the surface of (b), the surface reverts to the flat one like (a). d Phase diagram of mixtures
of open- (1o) and closed-ring (1c) isomers. The melting point changes upon irradiation with UV
light (313 nm) on the crystal surface of 1o due to the change in molar ratio by the photoisomerization
407
S
S
Si
MeO
OMe
Si
F F F
F
F
F
Me
Me
Me
Me
Me
Me
S
S
OMe
MeO
Si
F
F
F
F
F
Si
Me
Me
Me
Me
Me
Me
1o
1c
UV
Vis.
(b)
(c)
0.0
0.2
0.4
0.6
0.8
1.0
0
20
40
60
80
100
120
140
160
[1c] / ([1o]+[1c])
Melting point /
o
C
1o:1c=78:22
(d)
(a)
Fig. 24.1 Photoinduced topographical changes on the surface of a single crystal of 1o. a Molecular
structures of 1o and 1c. Scanning electron microscope (SEM) image of a crystal surface of 1o b
before UV irradiation, and c after UV (254 nm, 12 W) irradiation for 10 min followed by storing for
24 h at 30 °C in the dark. (SEM images: ×1000). After visible-light (λ > 500 nm, 500 W, 20 min)
irradiation to the surface of (b), the surface reverts to the flat one like (a). d Phase diagram of mixtures
of open- (1o) and closed-ring (1c) isomers. The melting point changes upon irradiation with UV
light (313 nm) on the crystal surface of 1o due to the change in molar ratio by the photoisomerization