

18 π-Electronic Ion-Pairing Assemblies …
315
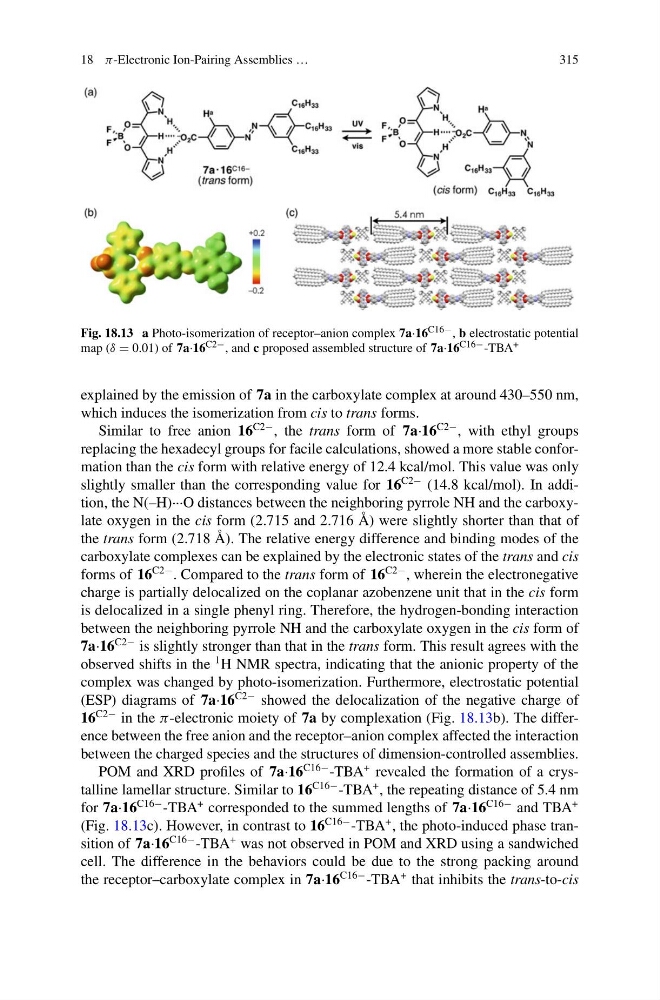
Fig. 18.13 a Photo-isomerization of receptor–anion complex 7a·16 C16− , b electrostatic potential
map (δ = 0.01) of 7a·16 C2− , and c proposed assembled structure of 7a·16 C16− -TBA +
explained by the emission of 7a in the carboxylate complex at around 430–550 nm,
which induces the isomerization from cis to trans forms.
Similar to free anion 16
C2− , the trans form of 7a·16
C2− , with ethyl groups
replacing the hexadecyl groups for facile calculations, showed a more stable conformation than the cis form with relative energy of 12.4 kcal/mol. This value was only
slightly smaller than the corresponding value for 16
C2− (14.8 kcal/mol). In addition, the N(–H)···O distances between the neighboring pyrrole NH and the carboxylate oxygen in the cis form (2.715 and 2.716 Å) were slightly shorter than that of
the trans form (2.718 Å). The relative energy difference and binding modes of the
carboxylate complexes can be explained by the electronic states of the trans and cis
forms of 16
C2− . Compared to the trans form of 16
C2− , wherein the electronegative
charge is partially delocalized on the coplanar azobenzene unit that in the cis form
is delocalized in a single phenyl ring. Therefore, the hydrogen-bonding interaction
between the neighboring pyrrole NH and the carboxylate oxygen in the cis form of
7a·16
C2− is slightly stronger than that in the trans form. This result agrees with the
observed shifts in the
1 H NMR spectra, indicating that the anionic property of the
complex was changed by photo-isomerization. Furthermore, electrostatic potential
(ESP) diagrams of 7a·16
C2− showed the delocalization of the negative charge of
16
C2− in the π-electronic moiety of 7a by complexation (Fig. 18.13b). The difference between the free anion and the receptor–anion complex affected the interaction
between the charged species and the structures of dimension-controlled assemblies.
POM and XRD profiles of 7a·16
C16− -TBA
+ revealed the formation of a crystalline lamellar structure. Similar to 16
C16− -TBA
+ , the repeating distance of 5.4 nm
for 7a·16
C16− -TBA
+ corresponded to the summed lengths of 7a·16
C16− and TBA
+
(Fig. 18.13c). However, in contrast to 16
C16− -TBA
+ , the photo-induced phase transition of 7a·16
C16− -TBA
+ was not observed in POM and XRD using a sandwiched
cell. The difference in the behaviors could be due to the strong packing around
the receptor–carboxylate complex in 7a·16
C16− -TBA
+ that inhibits the trans-to-cis
315
Fig. 18.13 a Photo-isomerization of receptor–anion complex 7a·16 C16− , b electrostatic potential
map (δ = 0.01) of 7a·16 C2− , and c proposed assembled structure of 7a·16 C16− -TBA +
explained by the emission of 7a in the carboxylate complex at around 430–550 nm,
which induces the isomerization from cis to trans forms.
Similar to free anion 16
C2− , the trans form of 7a·16
C2− , with ethyl groups
replacing the hexadecyl groups for facile calculations, showed a more stable conformation than the cis form with relative energy of 12.4 kcal/mol. This value was only
slightly smaller than the corresponding value for 16
C2− (14.8 kcal/mol). In addition, the N(–H)···O distances between the neighboring pyrrole NH and the carboxylate oxygen in the cis form (2.715 and 2.716 Å) were slightly shorter than that of
the trans form (2.718 Å). The relative energy difference and binding modes of the
carboxylate complexes can be explained by the electronic states of the trans and cis
forms of 16
C2− . Compared to the trans form of 16
C2− , wherein the electronegative
charge is partially delocalized on the coplanar azobenzene unit that in the cis form
is delocalized in a single phenyl ring. Therefore, the hydrogen-bonding interaction
between the neighboring pyrrole NH and the carboxylate oxygen in the cis form of
7a·16
C2− is slightly stronger than that in the trans form. This result agrees with the
observed shifts in the
1 H NMR spectra, indicating that the anionic property of the
complex was changed by photo-isomerization. Furthermore, electrostatic potential
(ESP) diagrams of 7a·16
C2− showed the delocalization of the negative charge of
16
C2− in the π-electronic moiety of 7a by complexation (Fig. 18.13b). The difference between the free anion and the receptor–anion complex affected the interaction
between the charged species and the structures of dimension-controlled assemblies.
POM and XRD profiles of 7a·16
C16− -TBA
+ revealed the formation of a crystalline lamellar structure. Similar to 16
C16− -TBA
+ , the repeating distance of 5.4 nm
for 7a·16
C16− -TBA
+ corresponded to the summed lengths of 7a·16
C16− and TBA
+
(Fig. 18.13c). However, in contrast to 16
C16− -TBA
+ , the photo-induced phase transition of 7a·16
C16− -TBA
+ was not observed in POM and XRD using a sandwiched
cell. The difference in the behaviors could be due to the strong packing around
the receptor–carboxylate complex in 7a·16
C16− -TBA
+ that inhibits the trans-to-cis