

20
H. Miyasaka et al.
the OFF → ON reaction of several molecules in one sec to enable the longtime
measurement.
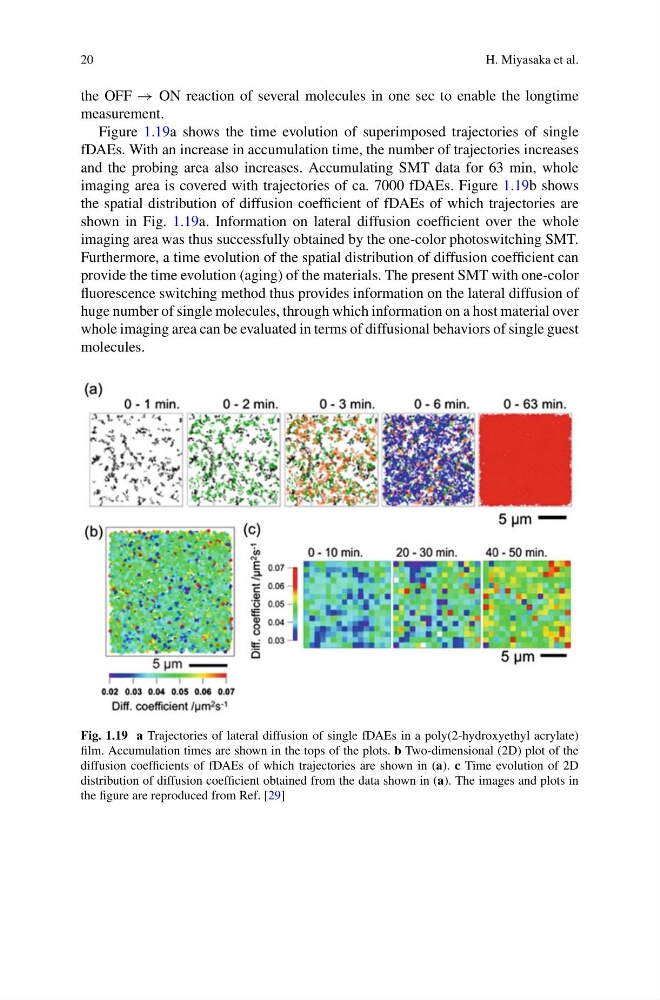
Figure 1.19a shows the time evolution of superimposed trajectories of single
fDAEs. With an increase in accumulation time, the number of trajectories increases
and the probing area also increases. Accumulating SMT data for 63 min, whole
imaging area is covered with trajectories of ca. 7000 fDAEs. Figure 1.19b shows
the spatial distribution of diffusion coefficient of fDAEs of which trajectories are
shown in Fig. 1.19a. Information on lateral diffusion coefficient over the whole
imaging area was thus successfully obtained by the one-color photoswitching SMT.
Furthermore, a time evolution of the spatial distribution of diffusion coefficient can
provide the time evolution (aging) of the materials. The present SMT with one-color
fluorescence switching method thus provides information on the lateral diffusion of
huge number of single molecules, through which information on a host material over
whole imaging area can be evaluated in terms of diffusional behaviors of single guest
molecules.
Fig. 1.19 a Trajectories of lateral diffusion of single fDAEs in a poly(2-hydroxyethyl acrylate)
film. Accumulation times are shown in the tops of the plots. b Two-dimensional (2D) plot of the
diffusion coefficients of fDAEs of which trajectories are shown in (a). c Time evolution of 2D
distribution of diffusion coefficient obtained from the data shown in (a). The images and plots in
the figure are reproduced from Ref. [29]
H. Miyasaka et al.
the OFF → ON reaction of several molecules in one sec to enable the longtime
measurement.
Figure 1.19a shows the time evolution of superimposed trajectories of single
fDAEs. With an increase in accumulation time, the number of trajectories increases
and the probing area also increases. Accumulating SMT data for 63 min, whole
imaging area is covered with trajectories of ca. 7000 fDAEs. Figure 1.19b shows
the spatial distribution of diffusion coefficient of fDAEs of which trajectories are
shown in Fig. 1.19a. Information on lateral diffusion coefficient over the whole
imaging area was thus successfully obtained by the one-color photoswitching SMT.
Furthermore, a time evolution of the spatial distribution of diffusion coefficient can
provide the time evolution (aging) of the materials. The present SMT with one-color
fluorescence switching method thus provides information on the lateral diffusion of
huge number of single molecules, through which information on a host material over
whole imaging area can be evaluated in terms of diffusional behaviors of single guest
molecules.
Fig. 1.19 a Trajectories of lateral diffusion of single fDAEs in a poly(2-hydroxyethyl acrylate)
film. Accumulation times are shown in the tops of the plots. b Two-dimensional (2D) plot of the
diffusion coefficients of fDAEs of which trajectories are shown in (a). c Time evolution of 2D
distribution of diffusion coefficient obtained from the data shown in (a). The images and plots in
the figure are reproduced from Ref. [29]