

226
T. Torimoto and T. Kameyama
As aforementioned, ZAIS QDs exhibited a very broad PL peak owing to energy
levels of defect sites in the bandgap. Although the PL QY of ZAIS QDs was considerably high, the lack of monochromaticity of PL was recognized as a major problem
in applications to biological imaging systems and LCD devices. Therefore, in order
to narrow the PL peak width, we investigated the influence of defect sites formed in
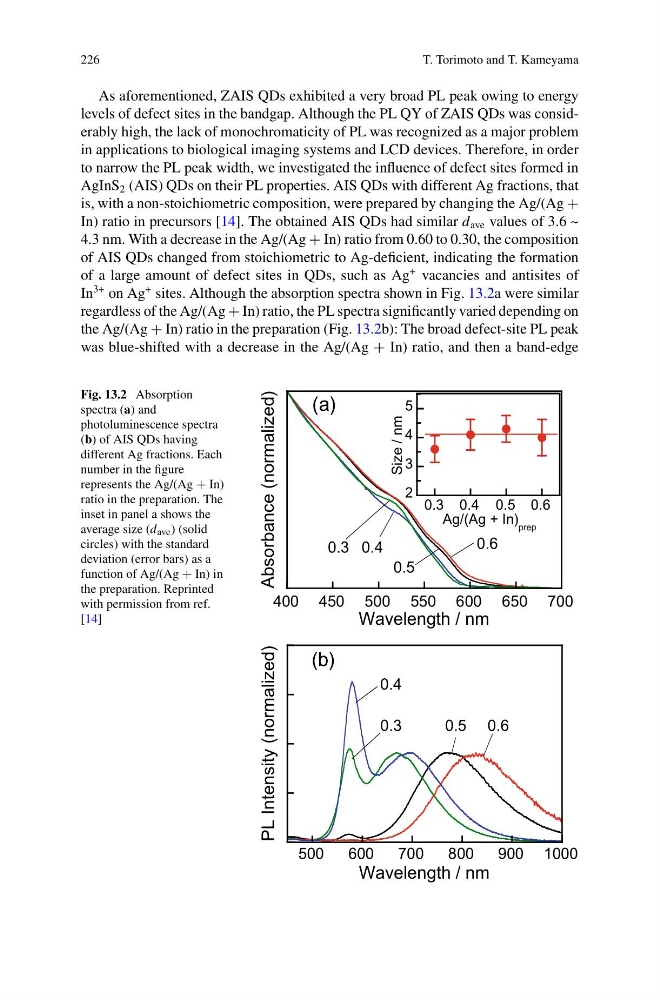
AgInS 2 (AIS) QDs on their PL properties. AIS QDs with different Ag fractions, that
is, with a non-stoichiometric composition, were prepared by changing the Ag/(Ag +
In) ratio in precursors [14]. The obtained AIS QDs had similar d ave values of 3.6 ~
4.3 nm. With a decrease in the Ag/(Ag + In) ratio from 0.60 to 0.30, the composition
of AIS QDs changed from stoichiometric to Ag-deficient, indicating the formation
of a large amount of defect sites in QDs, such as Ag
+ vacancies and antisites of
In
3+ on Ag
+ sites. Although the absorption spectra shown in Fig. 13.2a were similar
regardless of the Ag/(Ag + In) ratio, the PL spectra significantly varied depending on
the Ag/(Ag + In) ratio in the preparation (Fig. 13.2b): The broad defect-site PL peak
was blue-shifted with a decrease in the Ag/(Ag + In) ratio, and then a band-edge
Fig. 13.2 Absorption
spectra (a) and
photoluminescence spectra
(b) of AIS QDs having
different Ag fractions. Each
number in the figure
represents the Ag/(Ag + In)
ratio in the preparation. The
inset in panel a shows the
average size (d ave ) (solid
circles) with the standard
deviation (error bars) as a
function of Ag/(Ag + In) in
the preparation. Reprinted
with permission from ref.
[14]
500
600
700
800
900 1000
PL Intensity (normalized)
Wavelength / nm
0.6
(b)
0.5
0.3
0.4
400 450 500 550 600 650 700
Absorbance (normalized)
Wavelength / nm
0.6
0.5
0.3 0.4
(a)
2
3
4
5
0.3 0.4 0.5 0.6
Size / nm
Ag/(Ag + In) prep
T. Torimoto and T. Kameyama
As aforementioned, ZAIS QDs exhibited a very broad PL peak owing to energy
levels of defect sites in the bandgap. Although the PL QY of ZAIS QDs was considerably high, the lack of monochromaticity of PL was recognized as a major problem
in applications to biological imaging systems and LCD devices. Therefore, in order
to narrow the PL peak width, we investigated the influence of defect sites formed in
AgInS 2 (AIS) QDs on their PL properties. AIS QDs with different Ag fractions, that
is, with a non-stoichiometric composition, were prepared by changing the Ag/(Ag +
In) ratio in precursors [14]. The obtained AIS QDs had similar d ave values of 3.6 ~
4.3 nm. With a decrease in the Ag/(Ag + In) ratio from 0.60 to 0.30, the composition
of AIS QDs changed from stoichiometric to Ag-deficient, indicating the formation
of a large amount of defect sites in QDs, such as Ag
+ vacancies and antisites of
In
3+ on Ag
+ sites. Although the absorption spectra shown in Fig. 13.2a were similar
regardless of the Ag/(Ag + In) ratio, the PL spectra significantly varied depending on
the Ag/(Ag + In) ratio in the preparation (Fig. 13.2b): The broad defect-site PL peak
was blue-shifted with a decrease in the Ag/(Ag + In) ratio, and then a band-edge
Fig. 13.2 Absorption
spectra (a) and
photoluminescence spectra
(b) of AIS QDs having
different Ag fractions. Each
number in the figure
represents the Ag/(Ag + In)
ratio in the preparation. The
inset in panel a shows the
average size (d ave ) (solid
circles) with the standard
deviation (error bars) as a
function of Ag/(Ag + In) in
the preparation. Reprinted
with permission from ref.
[14]
500
600
700
800
900 1000
PL Intensity (normalized)
Wavelength / nm
0.6
(b)
0.5
0.3
0.4
400 450 500 550 600 650 700
Absorbance (normalized)
Wavelength / nm
0.6
0.5
0.3 0.4
(a)
2
3
4
5
0.3 0.4 0.5 0.6
Size / nm
Ag/(Ag + In) prep