

214
M. Sakamoto et al.
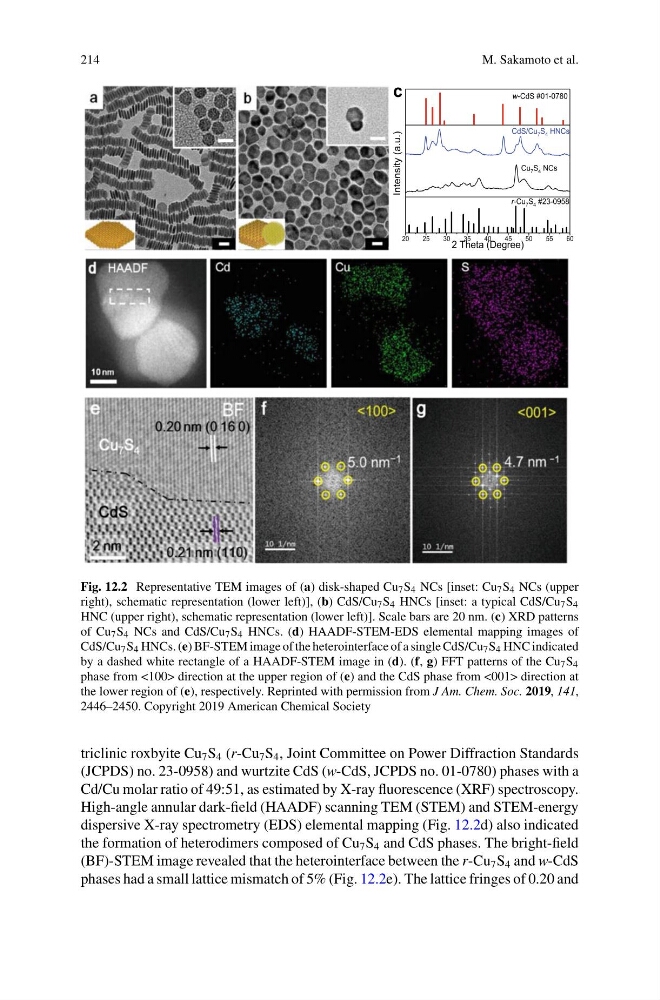
Fig. 12.2 Representative TEM images of (a) disk-shaped Cu 7 S 4 NCs [inset: Cu 7 S 4 NCs (upper
right), schematic representation (lower left)], (b) CdS/Cu 7 S 4 HNCs [inset: a typical CdS/Cu 7 S 4
HNC (upper right), schematic representation (lower left)]. Scale bars are 20 nm. (c) XRD patterns
of Cu 7 S 4 NCs and CdS/Cu 7 S 4 HNCs. (d) HAADF-STEM-EDS elemental mapping images of
CdS/Cu 7 S 4 HNCs. (e) BF-STEM image of the heterointerface of a single CdS/Cu 7 S 4 HNC indicated
by a dashed white rectangle of a HAADF-STEM image in (d). (f, g) FFT patterns of the Cu 7 S 4
phase from <100> direction at the upper region of (e) and the CdS phase from <001> direction at
the lower region of (e), respectively. Reprinted with permission from J Am. Chem. Soc. 2019, 141,
2446–2450. Copyright 2019 American Chemical Society
triclinic roxbyite Cu 7 S 4 (r-Cu 7 S 4 , Joint Committee on Power Diffraction Standards
(JCPDS) no. 23-0958) and wurtzite CdS (w-CdS, JCPDS no. 01-0780) phases with a
Cd/Cu molar ratio of 49:51, as estimated by X-ray fluorescence (XRF) spectroscopy.
High-angle annular dark-field (HAADF) scanning TEM (STEM) and STEM-energy
dispersive X-ray spectrometry (EDS) elemental mapping (Fig. 12.2d) also indicated
the formation of heterodimers composed of Cu 7 S 4 and CdS phases. The bright-field
(BF)-STEM image revealed that the heterointerface between the r-Cu 7 S 4 and w-CdS
phases had a small lattice mismatch of 5% (Fig. 12.2e). The lattice fringes of 0.20 and
M. Sakamoto et al.
Fig. 12.2 Representative TEM images of (a) disk-shaped Cu 7 S 4 NCs [inset: Cu 7 S 4 NCs (upper
right), schematic representation (lower left)], (b) CdS/Cu 7 S 4 HNCs [inset: a typical CdS/Cu 7 S 4
HNC (upper right), schematic representation (lower left)]. Scale bars are 20 nm. (c) XRD patterns
of Cu 7 S 4 NCs and CdS/Cu 7 S 4 HNCs. (d) HAADF-STEM-EDS elemental mapping images of
CdS/Cu 7 S 4 HNCs. (e) BF-STEM image of the heterointerface of a single CdS/Cu 7 S 4 HNC indicated
by a dashed white rectangle of a HAADF-STEM image in (d). (f, g) FFT patterns of the Cu 7 S 4
phase from <100> direction at the upper region of (e) and the CdS phase from <001> direction at
the lower region of (e), respectively. Reprinted with permission from J Am. Chem. Soc. 2019, 141,
2446–2450. Copyright 2019 American Chemical Society
triclinic roxbyite Cu 7 S 4 (r-Cu 7 S 4 , Joint Committee on Power Diffraction Standards
(JCPDS) no. 23-0958) and wurtzite CdS (w-CdS, JCPDS no. 01-0780) phases with a
Cd/Cu molar ratio of 49:51, as estimated by X-ray fluorescence (XRF) spectroscopy.
High-angle annular dark-field (HAADF) scanning TEM (STEM) and STEM-energy
dispersive X-ray spectrometry (EDS) elemental mapping (Fig. 12.2d) also indicated
the formation of heterodimers composed of Cu 7 S 4 and CdS phases. The bright-field
(BF)-STEM image revealed that the heterointerface between the r-Cu 7 S 4 and w-CdS
phases had a small lattice mismatch of 5% (Fig. 12.2e). The lattice fringes of 0.20 and