

1 Advanced Control of Photochemical Reactions …
11
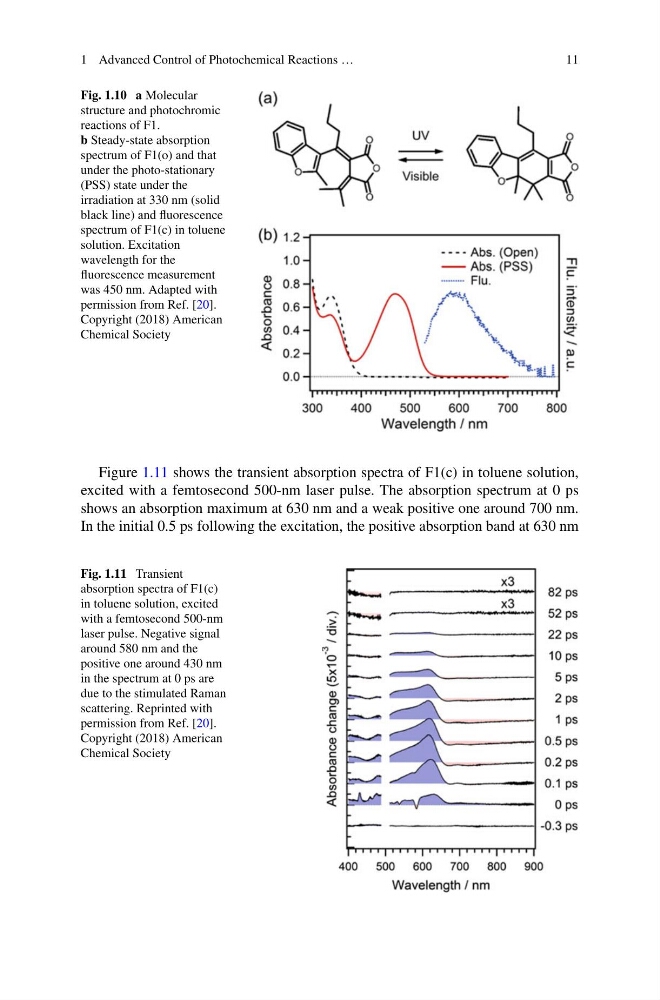
Fig. 1.10 a Molecular
structure and photochromic
reactions of F1.
b Steady-state absorption
spectrum of F1(o) and that
under the photo-stationary
(PSS) state under the
irradiation at 330 nm (solid
black line) and fluorescence
spectrum of F1(c) in toluene
solution. Excitation
wavelength for the
fluorescence measurement
was 450 nm. Adapted with
permission from Ref. [20].
Copyright (2018) American
Chemical Society
Figure 1.11 shows the transient absorption spectra of F1(c) in toluene solution,
excited with a femtosecond 500-nm laser pulse. The absorption spectrum at 0 ps
shows an absorption maximum at 630 nm and a weak positive one around 700 nm.
In the initial 0.5 ps following the excitation, the positive absorption band at 630 nm
Fig. 1.11 Transient
absorption spectra of F1(c)
in toluene solution, excited
with a femtosecond 500-nm
laser pulse. Negative signal
around 580 nm and the
positive one around 430 nm
in the spectrum at 0 ps are
due to the stimulated Raman
scattering. Reprinted with
permission from Ref. [20].
Copyright (2018) American
Chemical Society
11
Fig. 1.10 a Molecular
structure and photochromic
reactions of F1.
b Steady-state absorption
spectrum of F1(o) and that
under the photo-stationary
(PSS) state under the
irradiation at 330 nm (solid
black line) and fluorescence
spectrum of F1(c) in toluene
solution. Excitation
wavelength for the
fluorescence measurement
was 450 nm. Adapted with
permission from Ref. [20].
Copyright (2018) American
Chemical Society
Figure 1.11 shows the transient absorption spectra of F1(c) in toluene solution,
excited with a femtosecond 500-nm laser pulse. The absorption spectrum at 0 ps
shows an absorption maximum at 630 nm and a weak positive one around 700 nm.
In the initial 0.5 ps following the excitation, the positive absorption band at 630 nm
Fig. 1.11 Transient
absorption spectra of F1(c)
in toluene solution, excited
with a femtosecond 500-nm
laser pulse. Negative signal
around 580 nm and the
positive one around 430 nm
in the spectrum at 0 ps are
due to the stimulated Raman
scattering. Reprinted with
permission from Ref. [20].
Copyright (2018) American
Chemical Society