

10 Hot Carrier Transfer and Carrier Manipulation of Semiconductor …
185
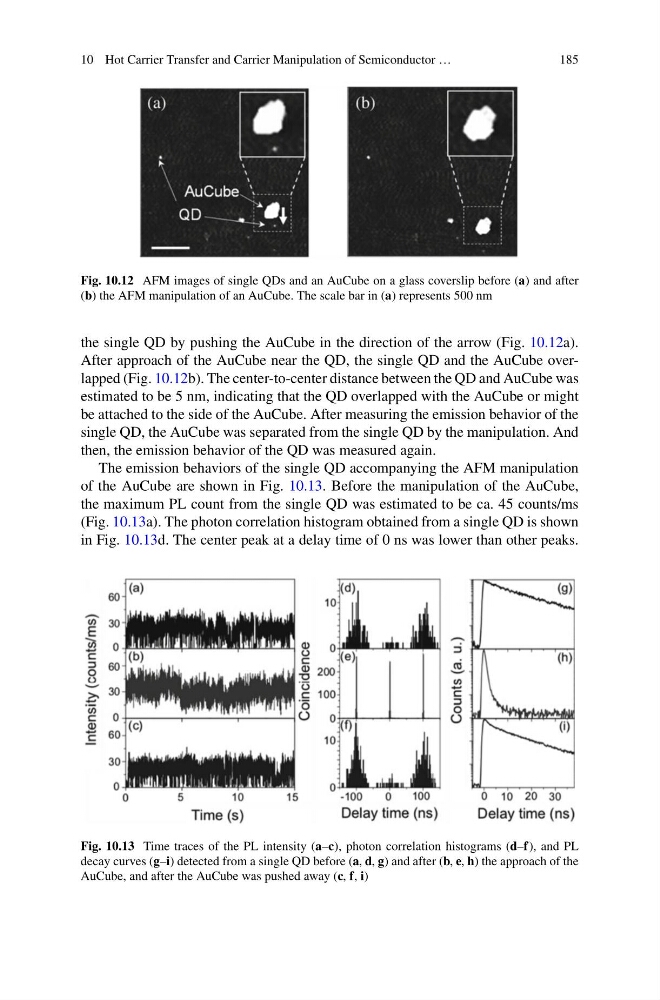
Fig. 10.12 AFM images of single QDs and an AuCube on a glass coverslip before (a) and after
(b) the AFM manipulation of an AuCube. The scale bar in (a) represents 500 nm
the single QD by pushing the AuCube in the direction of the arrow (Fig. 10.12a).
After approach of the AuCube near the QD, the single QD and the AuCube overlapped (Fig. 10.12b). The center-to-center distance between the QD and AuCube was
estimated to be 5 nm, indicating that the QD overlapped with the AuCube or might
be attached to the side of the AuCube. After measuring the emission behavior of the
single QD, the AuCube was separated from the single QD by the manipulation. And
then, the emission behavior of the QD was measured again.
The emission behaviors of the single QD accompanying the AFM manipulation
of the AuCube are shown in Fig. 10.13. Before the manipulation of the AuCube,
the maximum PL count from the single QD was estimated to be ca. 45 counts/ms
(Fig. 10.13a). The photon correlation histogram obtained from a single QD is shown
in Fig. 10.13d. The center peak at a delay time of 0 ns was lower than other peaks.
Fig. 10.13 Time traces of the PL intensity (a–c), photon correlation histograms (d–f), and PL
decay curves (g–i) detected from a single QD before (a, d, g) and after (b, e, h) the approach of the
AuCube, and after the AuCube was pushed away (c, f, i)
185
Fig. 10.12 AFM images of single QDs and an AuCube on a glass coverslip before (a) and after
(b) the AFM manipulation of an AuCube. The scale bar in (a) represents 500 nm
the single QD by pushing the AuCube in the direction of the arrow (Fig. 10.12a).
After approach of the AuCube near the QD, the single QD and the AuCube overlapped (Fig. 10.12b). The center-to-center distance between the QD and AuCube was
estimated to be 5 nm, indicating that the QD overlapped with the AuCube or might
be attached to the side of the AuCube. After measuring the emission behavior of the
single QD, the AuCube was separated from the single QD by the manipulation. And
then, the emission behavior of the QD was measured again.
The emission behaviors of the single QD accompanying the AFM manipulation
of the AuCube are shown in Fig. 10.13. Before the manipulation of the AuCube,
the maximum PL count from the single QD was estimated to be ca. 45 counts/ms
(Fig. 10.13a). The photon correlation histogram obtained from a single QD is shown
in Fig. 10.13d. The center peak at a delay time of 0 ns was lower than other peaks.
Fig. 10.13 Time traces of the PL intensity (a–c), photon correlation histograms (d–f), and PL
decay curves (g–i) detected from a single QD before (a, d, g) and after (b, e, h) the approach of the
AuCube, and after the AuCube was pushed away (c, f, i)