

142
K. Ueno
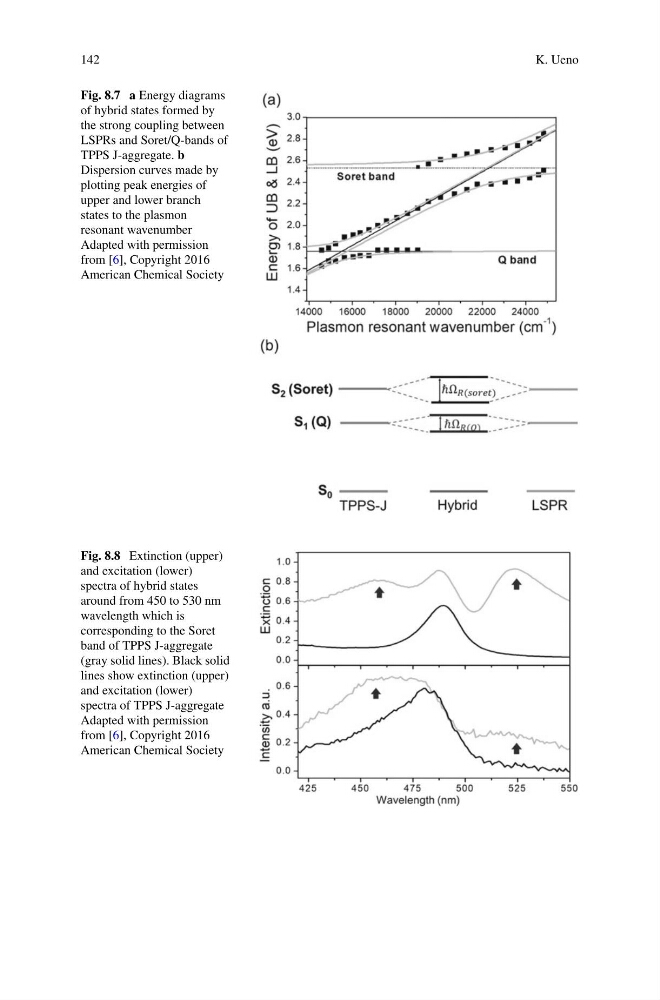
Fig. 8.7 a Energy diagrams
of hybrid states formed by
the strong coupling between
LSPRs and Soret/Q-bands of
TPPS J-aggregate. b
Dispersion curves made by
plotting peak energies of
upper and lower branch
states to the plasmon
resonant wavenumber
Adapted with permission
from [6], Copyright 2016
American Chemical Society
Fig. 8.8 Extinction (upper)
and excitation (lower)
spectra of hybrid states
around from 450 to 530 nm
wavelength which is
corresponding to the Soret
band of TPPS J-aggregate
(gray solid lines). Black solid
lines show extinction (upper)
and excitation (lower)
spectra of TPPS J-aggregate
Adapted with permission
from [6], Copyright 2016
American Chemical Society
K. Ueno
Fig. 8.7 a Energy diagrams
of hybrid states formed by
the strong coupling between
LSPRs and Soret/Q-bands of
TPPS J-aggregate. b
Dispersion curves made by
plotting peak energies of
upper and lower branch
states to the plasmon
resonant wavenumber
Adapted with permission
from [6], Copyright 2016
American Chemical Society
Fig. 8.8 Extinction (upper)
and excitation (lower)
spectra of hybrid states
around from 450 to 530 nm
wavelength which is
corresponding to the Soret
band of TPPS J-aggregate
(gray solid lines). Black solid
lines show extinction (upper)
and excitation (lower)
spectra of TPPS J-aggregate
Adapted with permission
from [6], Copyright 2016
American Chemical Society