

140
K. Ueno
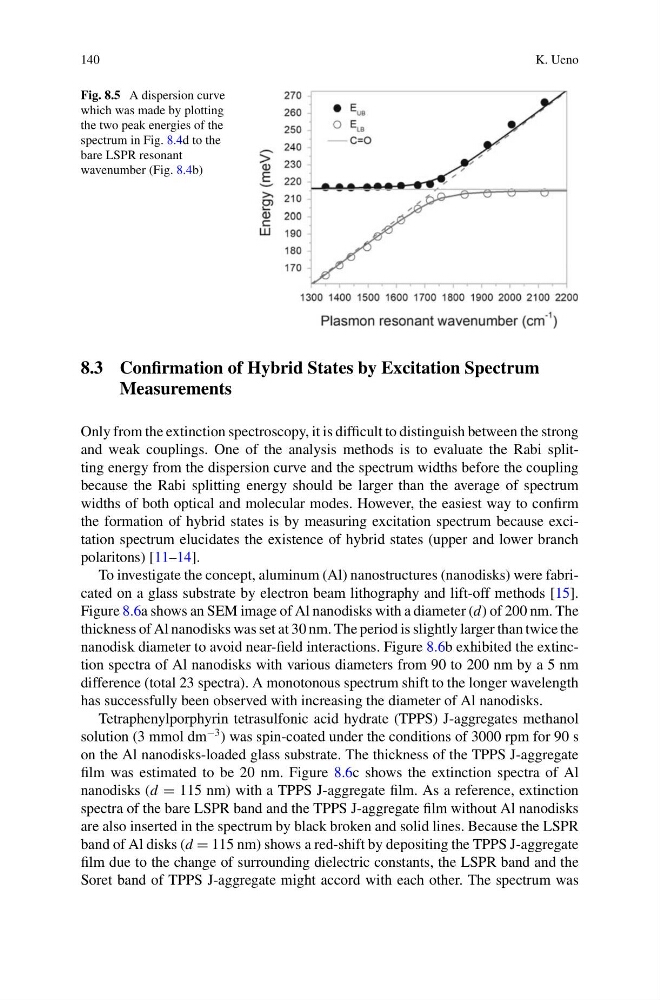
Fig. 8.5 A dispersion curve
which was made by plotting
the two peak energies of the
spectrum in Fig. 8.4d to the
bare LSPR resonant
wavenumber (Fig. 8.4b)
8.3 Confirmation of Hybrid States by Excitation Spectrum
Measurements
Only from the extinction spectroscopy, it is difficult to distinguish between the strong
and weak couplings. One of the analysis methods is to evaluate the Rabi splitting energy from the dispersion curve and the spectrum widths before the coupling
because the Rabi splitting energy should be larger than the average of spectrum
widths of both optical and molecular modes. However, the easiest way to confirm
the formation of hybrid states is by measuring excitation spectrum because excitation spectrum elucidates the existence of hybrid states (upper and lower branch
polaritons) [11–14].
To investigate the concept, aluminum (Al) nanostructures (nanodisks) were fabricated on a glass substrate by electron beam lithography and lift-off methods [15].
Figure 8.6a shows an SEM image of Al nanodisks with a diameter (d) of 200 nm. The
thickness of Al nanodisks was set at 30 nm. The period is slightly larger than twice the
nanodisk diameter to avoid near-field interactions. Figure 8.6b exhibited the extinction spectra of Al nanodisks with various diameters from 90 to 200 nm by a 5 nm
difference (total 23 spectra). A monotonous spectrum shift to the longer wavelength
has successfully been observed with increasing the diameter of Al nanodisks.
Tetraphenylporphyrin tetrasulfonic acid hydrate (TPPS) J-aggregates methanol
solution (3 mmol dm
−3 ) was spin-coated under the conditions of 3000 rpm for 90 s
on the Al nanodisks-loaded glass substrate. The thickness of the TPPS J-aggregate
film was estimated to be 20 nm. Figure 8.6c shows the extinction spectra of Al
nanodisks (d = 115 nm) with a TPPS J-aggregate film. As a reference, extinction
spectra of the bare LSPR band and the TPPS J-aggregate film without Al nanodisks
are also inserted in the spectrum by black broken and solid lines. Because the LSPR
band of Al disks (d = 115 nm) shows a red-shift by depositing the TPPS J-aggregate
film due to the change of surrounding dielectric constants, the LSPR band and the
Soret band of TPPS J-aggregate might accord with each other. The spectrum was
K. Ueno
Fig. 8.5 A dispersion curve
which was made by plotting
the two peak energies of the
spectrum in Fig. 8.4d to the
bare LSPR resonant
wavenumber (Fig. 8.4b)
8.3 Confirmation of Hybrid States by Excitation Spectrum
Measurements
Only from the extinction spectroscopy, it is difficult to distinguish between the strong
and weak couplings. One of the analysis methods is to evaluate the Rabi splitting energy from the dispersion curve and the spectrum widths before the coupling
because the Rabi splitting energy should be larger than the average of spectrum
widths of both optical and molecular modes. However, the easiest way to confirm
the formation of hybrid states is by measuring excitation spectrum because excitation spectrum elucidates the existence of hybrid states (upper and lower branch
polaritons) [11–14].
To investigate the concept, aluminum (Al) nanostructures (nanodisks) were fabricated on a glass substrate by electron beam lithography and lift-off methods [15].
Figure 8.6a shows an SEM image of Al nanodisks with a diameter (d) of 200 nm. The
thickness of Al nanodisks was set at 30 nm. The period is slightly larger than twice the
nanodisk diameter to avoid near-field interactions. Figure 8.6b exhibited the extinction spectra of Al nanodisks with various diameters from 90 to 200 nm by a 5 nm
difference (total 23 spectra). A monotonous spectrum shift to the longer wavelength
has successfully been observed with increasing the diameter of Al nanodisks.
Tetraphenylporphyrin tetrasulfonic acid hydrate (TPPS) J-aggregates methanol
solution (3 mmol dm
−3 ) was spin-coated under the conditions of 3000 rpm for 90 s
on the Al nanodisks-loaded glass substrate. The thickness of the TPPS J-aggregate
film was estimated to be 20 nm. Figure 8.6c shows the extinction spectra of Al
nanodisks (d = 115 nm) with a TPPS J-aggregate film. As a reference, extinction
spectra of the bare LSPR band and the TPPS J-aggregate film without Al nanodisks
are also inserted in the spectrum by black broken and solid lines. Because the LSPR
band of Al disks (d = 115 nm) shows a red-shift by depositing the TPPS J-aggregate
film due to the change of surrounding dielectric constants, the LSPR band and the
Soret band of TPPS J-aggregate might accord with each other. The spectrum was