

6 Advanced Function Control of Photochemical Reactions …
109
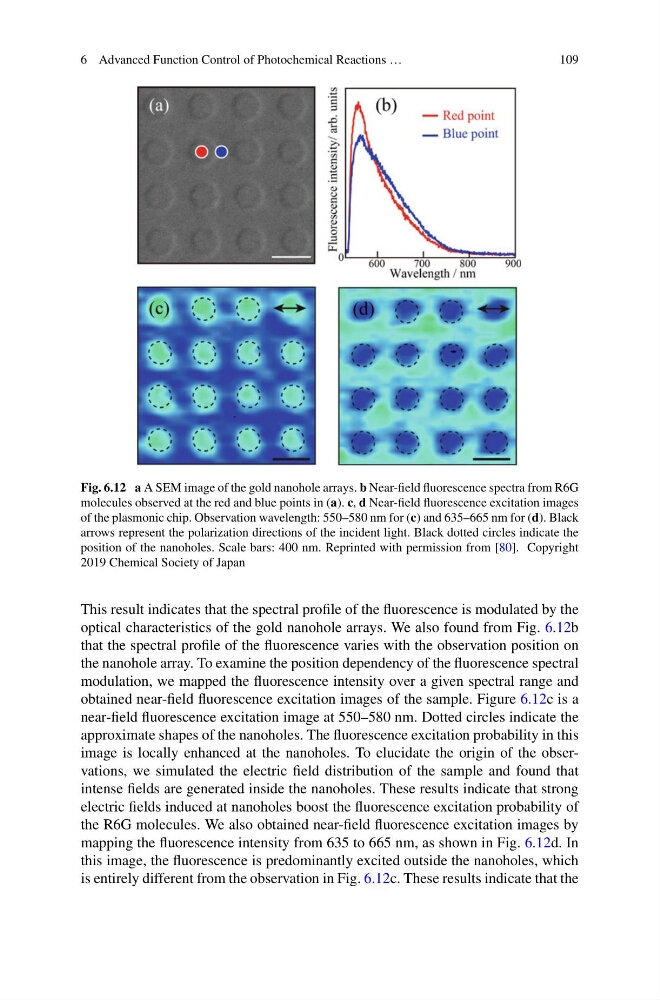
Fig. 6.12 a A SEM image of the gold nanohole arrays. b Near-field fluorescence spectra from R6G
molecules observed at the red and blue points in (a). c, d Near-field fluorescence excitation images
of the plasmonic chip. Observation wavelength: 550–580 nm for (c) and 635–665 nm for (d). Black
arrows represent the polarization directions of the incident light. Black dotted circles indicate the
position of the nanoholes. Scale bars: 400 nm. Reprinted with permission from [80]. Copyright
2019 Chemical Society of Japan
This result indicates that the spectral profile of the fluorescence is modulated by the
optical characteristics of the gold nanohole arrays. We also found from Fig. 6.12b
that the spectral profile of the fluorescence varies with the observation position on
the nanohole array. To examine the position dependency of the fluorescence spectral
modulation, we mapped the fluorescence intensity over a given spectral range and
obtained near-field fluorescence excitation images of the sample. Figure 6.12c is a
near-field fluorescence excitation image at 550–580 nm. Dotted circles indicate the
approximate shapes of the nanoholes. The fluorescence excitation probability in this
image is locally enhanced at the nanoholes. To elucidate the origin of the observations, we simulated the electric field distribution of the sample and found that
intense fields are generated inside the nanoholes. These results indicate that strong
electric fields induced at nanoholes boost the fluorescence excitation probability of
the R6G molecules. We also obtained near-field fluorescence excitation images by
mapping the fluorescence intensity from 635 to 665 nm, as shown in Fig. 6.12d. In
this image, the fluorescence is predominantly excited outside the nanoholes, which
is entirely different from the observation in Fig. 6.12c. These results indicate that the
109
Fig. 6.12 a A SEM image of the gold nanohole arrays. b Near-field fluorescence spectra from R6G
molecules observed at the red and blue points in (a). c, d Near-field fluorescence excitation images
of the plasmonic chip. Observation wavelength: 550–580 nm for (c) and 635–665 nm for (d). Black
arrows represent the polarization directions of the incident light. Black dotted circles indicate the
position of the nanoholes. Scale bars: 400 nm. Reprinted with permission from [80]. Copyright
2019 Chemical Society of Japan
This result indicates that the spectral profile of the fluorescence is modulated by the
optical characteristics of the gold nanohole arrays. We also found from Fig. 6.12b
that the spectral profile of the fluorescence varies with the observation position on
the nanohole array. To examine the position dependency of the fluorescence spectral
modulation, we mapped the fluorescence intensity over a given spectral range and
obtained near-field fluorescence excitation images of the sample. Figure 6.12c is a
near-field fluorescence excitation image at 550–580 nm. Dotted circles indicate the
approximate shapes of the nanoholes. The fluorescence excitation probability in this
image is locally enhanced at the nanoholes. To elucidate the origin of the observations, we simulated the electric field distribution of the sample and found that
intense fields are generated inside the nanoholes. These results indicate that strong
electric fields induced at nanoholes boost the fluorescence excitation probability of
the R6G molecules. We also obtained near-field fluorescence excitation images by
mapping the fluorescence intensity from 635 to 665 nm, as shown in Fig. 6.12d. In
this image, the fluorescence is predominantly excited outside the nanoholes, which
is entirely different from the observation in Fig. 6.12c. These results indicate that the