

6 Advanced Function Control of Photochemical Reactions …
103
d are perpendicular, and hence the two eigenmodes do not coherently interact with
each other. From this consideration, we calculated the spatial superposition of the
eigenmodes, as shown in Fig. 6.7e. The spatial pattern of this image is consistent
with that of the near-field transmission image (Fig. 6.7b), which means the two
eigenmodes are spectrally overlapped, and consequently, the spatial superposition of
these modes is experimentally observed.
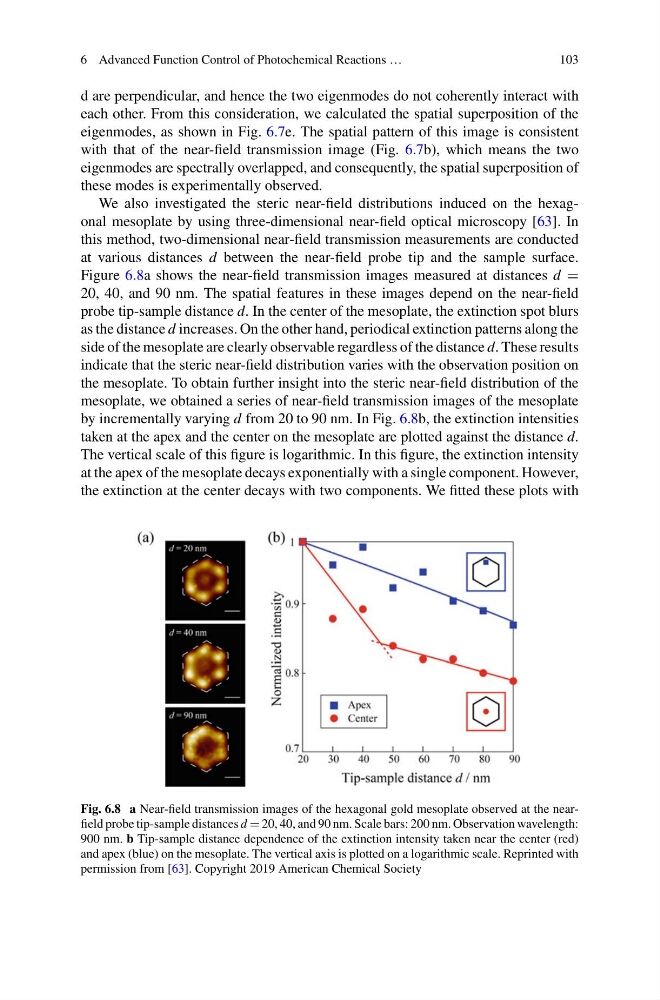
We also investigated the steric near-field distributions induced on the hexagonal mesoplate by using three-dimensional near-field optical microscopy [63]. In
this method, two-dimensional near-field transmission measurements are conducted
at various distances d between the near-field probe tip and the sample surface.
Figure 6.8a shows the near-field transmission images measured at distances d =
20, 40, and 90 nm. The spatial features in these images depend on the near-field
probe tip-sample distance d. In the center of the mesoplate, the extinction spot blurs
as the distance d increases. On the other hand, periodical extinction patterns along the
side of the mesoplate are clearly observable regardless of the distance d. These results
indicate that the steric near-field distribution varies with the observation position on
the mesoplate. To obtain further insight into the steric near-field distribution of the
mesoplate, we obtained a series of near-field transmission images of the mesoplate
by incrementally varying d from 20 to 90 nm. In Fig. 6.8b, the extinction intensities
taken at the apex and the center on the mesoplate are plotted against the distance d.
The vertical scale of this figure is logarithmic. In this figure, the extinction intensity
at the apex of the mesoplate decays exponentially with a single component. However,
the extinction at the center decays with two components. We fitted these plots with
Fig. 6.8 a Near-field transmission images of the hexagonal gold mesoplate observed at the nearfield probe tip-sample distances d = 20, 40, and 90 nm. Scale bars: 200 nm. Observation wavelength:
900 nm. b Tip-sample distance dependence of the extinction intensity taken near the center (red)
and apex (blue) on the mesoplate. The vertical axis is plotted on a logarithmic scale. Reprinted with
permission from [63]. Copyright 2019 American Chemical Society
103
d are perpendicular, and hence the two eigenmodes do not coherently interact with
each other. From this consideration, we calculated the spatial superposition of the
eigenmodes, as shown in Fig. 6.7e. The spatial pattern of this image is consistent
with that of the near-field transmission image (Fig. 6.7b), which means the two
eigenmodes are spectrally overlapped, and consequently, the spatial superposition of
these modes is experimentally observed.
We also investigated the steric near-field distributions induced on the hexagonal mesoplate by using three-dimensional near-field optical microscopy [63]. In
this method, two-dimensional near-field transmission measurements are conducted
at various distances d between the near-field probe tip and the sample surface.
Figure 6.8a shows the near-field transmission images measured at distances d =
20, 40, and 90 nm. The spatial features in these images depend on the near-field
probe tip-sample distance d. In the center of the mesoplate, the extinction spot blurs
as the distance d increases. On the other hand, periodical extinction patterns along the
side of the mesoplate are clearly observable regardless of the distance d. These results
indicate that the steric near-field distribution varies with the observation position on
the mesoplate. To obtain further insight into the steric near-field distribution of the
mesoplate, we obtained a series of near-field transmission images of the mesoplate
by incrementally varying d from 20 to 90 nm. In Fig. 6.8b, the extinction intensities
taken at the apex and the center on the mesoplate are plotted against the distance d.
The vertical scale of this figure is logarithmic. In this figure, the extinction intensity
at the apex of the mesoplate decays exponentially with a single component. However,
the extinction at the center decays with two components. We fitted these plots with
Fig. 6.8 a Near-field transmission images of the hexagonal gold mesoplate observed at the nearfield probe tip-sample distances d = 20, 40, and 90 nm. Scale bars: 200 nm. Observation wavelength:
900 nm. b Tip-sample distance dependence of the extinction intensity taken near the center (red)
and apex (blue) on the mesoplate. The vertical axis is plotted on a logarithmic scale. Reprinted with
permission from [63]. Copyright 2019 American Chemical Society