

98
K. Imaeda and K. Imura
reflection images of the triangular silver mesoplate (edge length ~600 nm, thickness ~25 nm) obtained without and with phase-stepping modulation, respectively.
In Fig. 6.3a, the reflection signals from the sample are buried in the large background, and thus the near-field spatial pattern of the mesoplate is not observable. On
the other hand, in Fig. 6.3b, the near-field reflection signals are substantially recovered on the mesoplate, and the unique spatial pattern is clearly visualized inside the
mesoplate. From theoretical calculations, the observed spatial pattern is assignable
to the plasmon mode resonantly excited in the triangular mesoplate. These results
imply that the phase-stepping modulation technique is very useful for improving
the signal-to-noise ratio under the I-C mode of the SNOM. The present results also
prove that the developed near-field reflection imaging method is a powerful tool for
the near-field characterization of elementary excitations in opaque mesostructures.
6.3 Near-Field Characterization of Mesoscopic Structures
In general, the macroscopic optical response of a bulk material can be described by
the dielectric function of the constituent material [40]. On the other hand, the optical
response of the mesostructure is also strongly dependent on its geometrical shape,
since the shape provides the boundary condition of the spatial mode of the elementary
excitations induced in the mesostructure [41]. Therefore, the spatial mode patterns of
elementary excitations vary enormously depending on the geometrical shapes of the
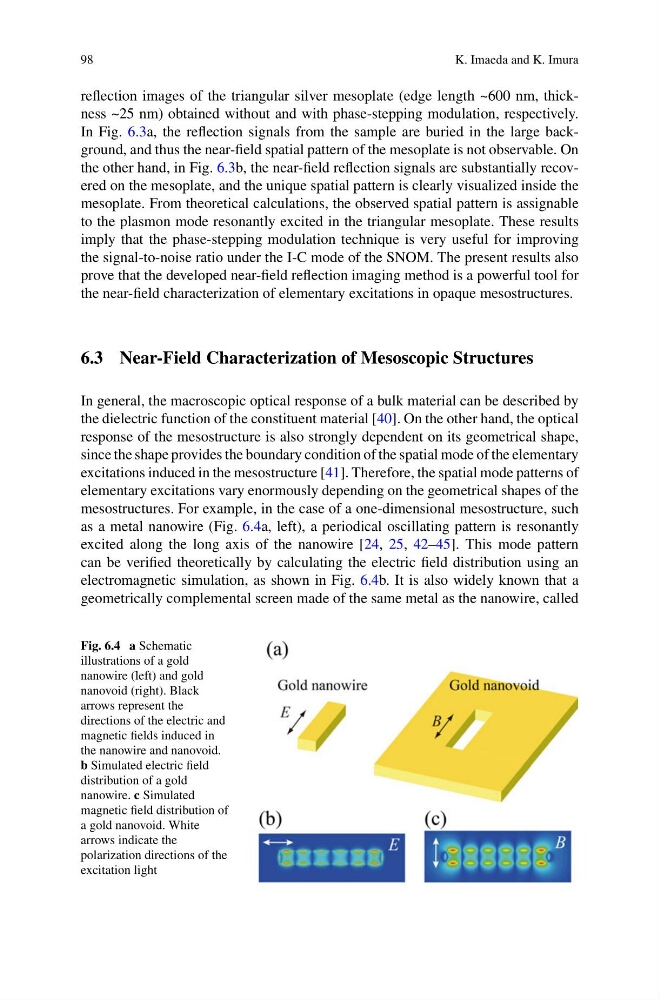
mesostructures. For example, in the case of a one-dimensional mesostructure, such
as a metal nanowire (Fig. 6.4a, left), a periodical oscillating pattern is resonantly
excited along the long axis of the nanowire [24, 25, 42–45]. This mode pattern
can be verified theoretically by calculating the electric field distribution using an
electromagnetic simulation, as shown in Fig. 6.4b. It is also widely known that a
geometrically complemental screen made of the same metal as the nanowire, called
Fig. 6.4 a Schematic
illustrations of a gold
nanowire (left) and gold
nanovoid (right). Black
arrows represent the
directions of the electric and
magnetic fields induced in
the nanowire and nanovoid.
b Simulated electric field
distribution of a gold
nanowire. c Simulated
magnetic field distribution of
a gold nanovoid. White
arrows indicate the
polarization directions of the
excitation light
K. Imaeda and K. Imura
reflection images of the triangular silver mesoplate (edge length ~600 nm, thickness ~25 nm) obtained without and with phase-stepping modulation, respectively.
In Fig. 6.3a, the reflection signals from the sample are buried in the large background, and thus the near-field spatial pattern of the mesoplate is not observable. On
the other hand, in Fig. 6.3b, the near-field reflection signals are substantially recovered on the mesoplate, and the unique spatial pattern is clearly visualized inside the
mesoplate. From theoretical calculations, the observed spatial pattern is assignable
to the plasmon mode resonantly excited in the triangular mesoplate. These results
imply that the phase-stepping modulation technique is very useful for improving
the signal-to-noise ratio under the I-C mode of the SNOM. The present results also
prove that the developed near-field reflection imaging method is a powerful tool for
the near-field characterization of elementary excitations in opaque mesostructures.
6.3 Near-Field Characterization of Mesoscopic Structures
In general, the macroscopic optical response of a bulk material can be described by
the dielectric function of the constituent material [40]. On the other hand, the optical
response of the mesostructure is also strongly dependent on its geometrical shape,
since the shape provides the boundary condition of the spatial mode of the elementary
excitations induced in the mesostructure [41]. Therefore, the spatial mode patterns of
elementary excitations vary enormously depending on the geometrical shapes of the
mesostructures. For example, in the case of a one-dimensional mesostructure, such
as a metal nanowire (Fig. 6.4a, left), a periodical oscillating pattern is resonantly
excited along the long axis of the nanowire [24, 25, 42–45]. This mode pattern
can be verified theoretically by calculating the electric field distribution using an
electromagnetic simulation, as shown in Fig. 6.4b. It is also widely known that a
geometrically complemental screen made of the same metal as the nanowire, called
Fig. 6.4 a Schematic
illustrations of a gold
nanowire (left) and gold
nanovoid (right). Black
arrows represent the
directions of the electric and
magnetic fields induced in
the nanowire and nanovoid.
b Simulated electric field
distribution of a gold
nanowire. c Simulated
magnetic field distribution of
a gold nanovoid. White
arrows indicate the
polarization directions of the
excitation light