

362
Water for Energy and Fuel Production
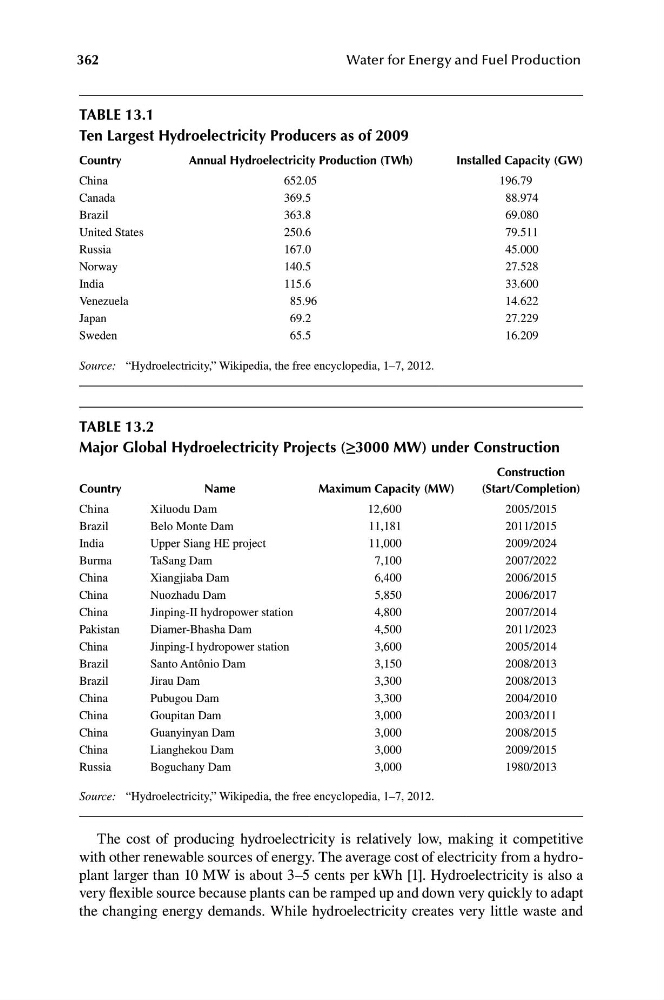
taBle 13.1
ten largest hydroelectricity Producers as of 2009
Country
annual hydroelectricity Production (tWh)
installed Capacity (GW)
China
652.05
196.79
Canada
369.5
88.974
Brazil
363.8
69.080
United States
250.6
79.511
Russia
167.0
45.000
Norway
140.5
27.528
India
115.6
33.600
Venezuela
85.96
14.622
Japan
69.2
27.229
Sweden
65.5
16.209
Source: “Hydroelectricity,” Wikipedia, the free encyclopedia, 1–7, 2012.
taBle 13.2
major Global hydroelectricity Projects (≥3000 mW) under Construction
Construction
Country
name
maximum Capacity (mW)
(start/Completion)
China
xiluodu Dam
12,600
2005/2015
Brazil
Belo Monte Dam
11,181
2011/2015
India
Upper Siang HE project
11,000
2009/2024
Burma
TaSang Dam
7,100
2007/2022
China
xiangjiaba Dam
6,400
2006/2015
China
Nuozhadu Dam
5,850
2006/2017
China
Jinping-II hydropower station
4,800
2007/2014
Pakistan
Diamer-Bhasha Dam
4,500
2011/2023
China
Jinping-I hydropower station
3,600
2005/2014
Brazil
Santo Antônio Dam
3,150
2008/2013
Brazil
Jirau Dam
3,300
2008/2013
China
Pubugou Dam
3,300
2004/2010
China
Goupitan Dam
3,000
2003/2011
China
Guanyinyan Dam
3,000
2008/2015
China
Lianghekou Dam
3,000
2009/2015
Russia
Boguchany Dam
3,000
1980/2013
Source: “Hydroelectricity,” Wikipedia, the free encyclopedia, 1–7, 2012.
The cost of producing hydroelectricity is relatively low, making it competitive
with other renewable sources of energy. The average cost of electricity from a hydroplant larger than 10 MW is about 3–5 cents per kWh [1]. Hydroelectricity is also a
very flexible source because plants can be ramped up and down very quickly to adapt
the changing energy demands. While hydroelectricity creates very little waste and
Water for Energy and Fuel Production
taBle 13.1
ten largest hydroelectricity Producers as of 2009
Country
annual hydroelectricity Production (tWh)
installed Capacity (GW)
China
652.05
196.79
Canada
369.5
88.974
Brazil
363.8
69.080
United States
250.6
79.511
Russia
167.0
45.000
Norway
140.5
27.528
India
115.6
33.600
Venezuela
85.96
14.622
Japan
69.2
27.229
Sweden
65.5
16.209
Source: “Hydroelectricity,” Wikipedia, the free encyclopedia, 1–7, 2012.
taBle 13.2
major Global hydroelectricity Projects (≥3000 mW) under Construction
Construction
Country
name
maximum Capacity (mW)
(start/Completion)
China
xiluodu Dam
12,600
2005/2015
Brazil
Belo Monte Dam
11,181
2011/2015
India
Upper Siang HE project
11,000
2009/2024
Burma
TaSang Dam
7,100
2007/2022
China
xiangjiaba Dam
6,400
2006/2015
China
Nuozhadu Dam
5,850
2006/2017
China
Jinping-II hydropower station
4,800
2007/2014
Pakistan
Diamer-Bhasha Dam
4,500
2011/2023
China
Jinping-I hydropower station
3,600
2005/2014
Brazil
Santo Antônio Dam
3,150
2008/2013
Brazil
Jirau Dam
3,300
2008/2013
China
Pubugou Dam
3,300
2004/2010
China
Goupitan Dam
3,000
2003/2011
China
Guanyinyan Dam
3,000
2008/2015
China
Lianghekou Dam
3,000
2009/2015
Russia
Boguchany Dam
3,000
1980/2013
Source: “Hydroelectricity,” Wikipedia, the free encyclopedia, 1–7, 2012.
The cost of producing hydroelectricity is relatively low, making it competitive
with other renewable sources of energy. The average cost of electricity from a hydroplant larger than 10 MW is about 3–5 cents per kWh [1]. Hydroelectricity is also a
very flexible source because plants can be ramped up and down very quickly to adapt
the changing energy demands. While hydroelectricity creates very little waste and