

3
Introduction
1. Since 1800, the energy and fuel landscape has been constantly changing
as new sources are developed and the old sources either dry up, or become
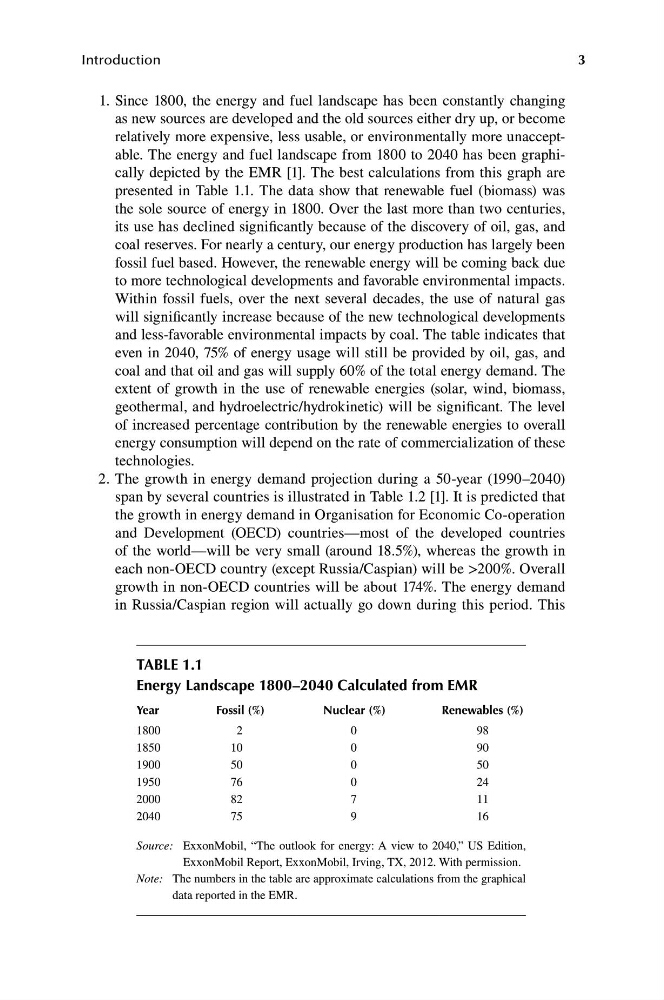
relatively more expensive, less usable, or environmentally more unacceptable. The energy and fuel landscape from 1800 to 2040 has been graphically depicted by the EMR [1]. The best calculations from this graph are
presented in Table 1.1. The data show that renewable fuel (biomass) was
the sole source of energy in 1800. Over the last more than two centuries,
its use has declined significantly because of the discovery of oil, gas, and
coal reserves. For nearly a century, our energy production has largely been
fossil fuel based. However, the renewable energy will be coming back due
to more technological developments and favorable environmental impacts.
Within fossil fuels, over the next several decades, the use of natural gas
will significantly increase because of the new technological developments
and less-favorable environmental impacts by coal. The table indicates that
even in 2040, 75% of energy usage will still be provided by oil, gas, and
coal and that oil and gas will supply 60% of the total energy demand. The
extent of growth in the use of renewable energies (solar, wind, biomass,
geothermal, and hydroelectric/hydrokinetic) will be significant. The level
of increased percentage contribution by the renewable energies to overall
energy consumption will depend on the rate of commercialization of these
technologies.
2. The growth in energy demand projection during a 50-year (1990–2040)
span by several countries is illustrated in Table 1.2 [1]. It is predicted that
the growth in energy demand in Organisation for Economic Co-operation
and Development (OECD) countries—most of the developed countries
of the world—will be very small (around 18.5%), whereas the growth in
each non-OECD country (except Russia/Caspian) will be >200%. Overall
growth in non-OECD countries will be about 174%. The energy demand
in Russia/Caspian region will actually go down during this period. This
taBle 1.1
energy landscape 1800–2040 Calculated from emr
year
Fossil (%)
nuclear (%)
renewables (%)
1800
2
0
98
1850
10
0
90
1900
50
0
50
1950
76
0
24
2000
82
7
11
2040
75
9
16
Source: ExxonMobil, “The outlook for energy: A view to 2040,” US Edition,
ExxonMobil Report, ExxonMobil, Irving, Tx, 2012. With permission.
Note: The numbers in the table are approximate calculations from the graphical
data reported in the EMR.
Introduction
1. Since 1800, the energy and fuel landscape has been constantly changing
as new sources are developed and the old sources either dry up, or become
relatively more expensive, less usable, or environmentally more unacceptable. The energy and fuel landscape from 1800 to 2040 has been graphically depicted by the EMR [1]. The best calculations from this graph are
presented in Table 1.1. The data show that renewable fuel (biomass) was
the sole source of energy in 1800. Over the last more than two centuries,
its use has declined significantly because of the discovery of oil, gas, and
coal reserves. For nearly a century, our energy production has largely been
fossil fuel based. However, the renewable energy will be coming back due
to more technological developments and favorable environmental impacts.
Within fossil fuels, over the next several decades, the use of natural gas
will significantly increase because of the new technological developments
and less-favorable environmental impacts by coal. The table indicates that
even in 2040, 75% of energy usage will still be provided by oil, gas, and
coal and that oil and gas will supply 60% of the total energy demand. The
extent of growth in the use of renewable energies (solar, wind, biomass,
geothermal, and hydroelectric/hydrokinetic) will be significant. The level
of increased percentage contribution by the renewable energies to overall
energy consumption will depend on the rate of commercialization of these
technologies.
2. The growth in energy demand projection during a 50-year (1990–2040)
span by several countries is illustrated in Table 1.2 [1]. It is predicted that
the growth in energy demand in Organisation for Economic Co-operation
and Development (OECD) countries—most of the developed countries
of the world—will be very small (around 18.5%), whereas the growth in
each non-OECD country (except Russia/Caspian) will be >200%. Overall
growth in non-OECD countries will be about 174%. The energy demand
in Russia/Caspian region will actually go down during this period. This
taBle 1.1
energy landscape 1800–2040 Calculated from emr
year
Fossil (%)
nuclear (%)
renewables (%)
1800
2
0
98
1850
10
0
90
1900
50
0
50
1950
76
0
24
2000
82
7
11
2040
75
9
16
Source: ExxonMobil, “The outlook for energy: A view to 2040,” US Edition,
ExxonMobil Report, ExxonMobil, Irving, Tx, 2012. With permission.
Note: The numbers in the table are approximate calculations from the graphical
data reported in the EMR.