

211
Anaerobic Digestion of Aqueous Waste for Methane and Hydrogen
Weiland [5], while the data shown in Table 8.1 need to be corrected for solubilization
of CO 2 in digestate, they clearly indicate that the biogas production follows the order:
raw fat > carbohydrates > protein. Lignin cannot be digested by the anaerobic process.
Protein generates more methane in biogas. Thus, the properties of the feedstock
play a very important role in the rate and composition of the biogas production. For
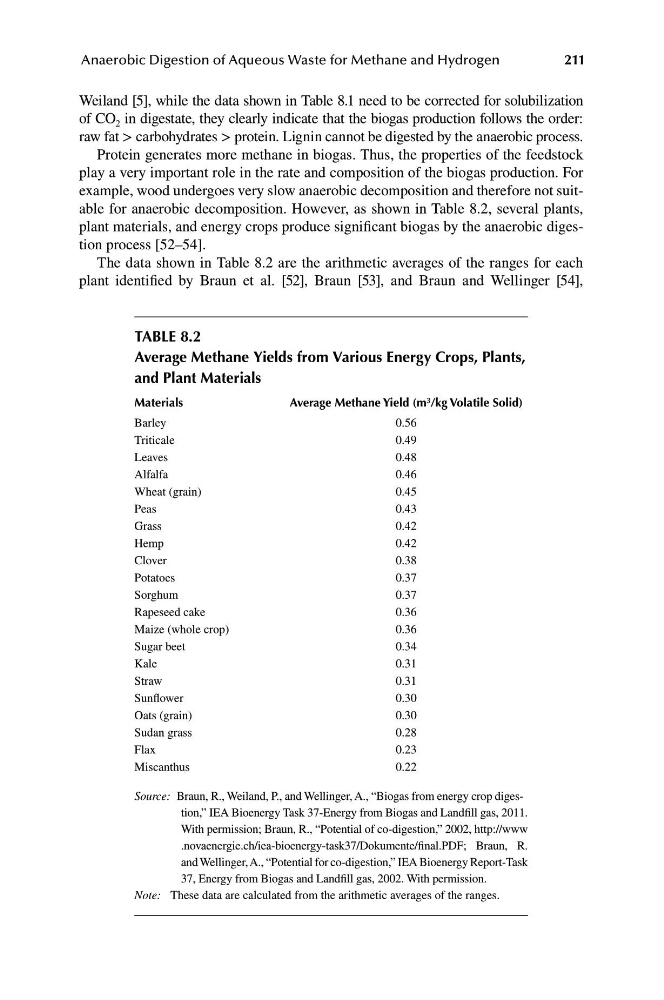
example, wood undergoes very slow anaerobic decomposition and therefore not suitable for anaerobic decomposition. However, as shown in Table 8.2, several plants,
plant materials, and energy crops produce significant biogas by the anaerobic digestion process [52–54].
The data shown in Table 8.2 are the arithmetic averages of the ranges for each
plant identified by Braun et al. [52], Braun [53], and Braun and Wellinger [54],
taBle 8.2
average methane yields from Various energy Crops, Plants,
and Plant materials
materials
average methane yield (m 3 /kg Volatile solid)
Barley
0.56
Triticale
0.49
Leaves
0.48
Alfalfa
0.46
Wheat (grain)
0.45
Peas
0.43
Grass
0.42
Hemp
0.42
Clover
0.38
Potatoes
0.37
Sorghum
0.37
Rapeseed cake
0.36
Maize (whole crop)
0.36
Sugar beet
0.34
Kale
0.31
Straw
0.31
Sunflower
0.30
Oats (grain)
0.30
Sudan grass
0.28
Flax
0.23
Miscanthus
0.22
Source: Braun, R., Weiland, P., and Wellinger, A., “Biogas from energy crop digestion,” IEA Bioenergy Task 37-Energy from Biogas and Landfill gas, 2011.
With permission; Braun, R., “Potential of co-digestion,” 2002, http://www
.novaenergie.ch/iea-bioenergy-task37/Dokumente/final.PDF; Braun, R.
and Wellinger, A., “Potential for co-digestion,” IEA Bioenergy Report-Task
37, Energy from Biogas and Landfill gas, 2002. With permission.
Note: These data are calculated from the arithmetic averages of the ranges.