

D r y p y r o l y s i s
H T C
Atomic ratio H/C (−)
2.0
1.5
1.0
0.5
0
0.75
0.25
0.5
Manure
Hydrochar
Hydrochar
Hydrochar
Charcoal
Cellulose
Wood
Bituminous
coal
Soft
lignite
Initial biomass
Atomic ratio O/C (−)
0.0
1.0
118
Water for Energy and Fuel Production
The solids produced from this process have been given many names such as char,
biocoal or biochar, or more accurately hydrochar to differentiate it from the char or
coal produced by the conventional dry pyrolysis. Significant reviews of hydrochar
have been published recently particularly on its production processes [18–28]. The
interest in hydrochar has increased very rapidly due to its connection to understand
natural coal formation [18–20,27], its use in creating new innovative materials [21],
and its application in soil quality improvement [22–28].
HTC can be an exothermic process, which lowers both oxygen and hydrogen content of the original feedstock mainly by dehydration and decarboxylation. The overall reaction identifying the heating value of the process can be expressed as [18–28]
C 6 H 12 O 5 → C 5.25 H 4 O 0.5 + 0.75CO 2 + 3H 2 O
(5.1)
The initial phase of this overall reaction, that is, hydrolysis of cellulose, is an e ndothermic
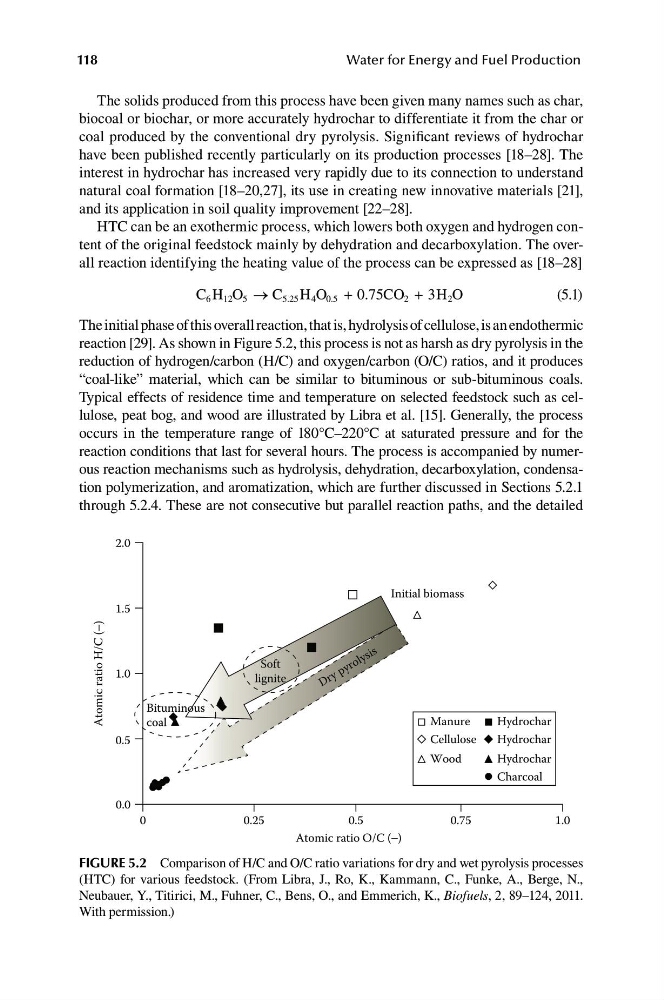
reaction [29]. As shown in Figure 5.2, this process is not as harsh as dry pyrolysis in the
reduction of hydrogen/carbon (H/C) and oxygen/carbon (O/C) ratios, and it produces
“coal-like” material, which can be similar to bituminous or sub- bituminous coals.
Typical effects of residence time and temperature on selected feedstock such as cellulose, peat bog, and wood are illustrated by Libra et al. [15]. Generally, the process
occurs in the temperature range of 180°C–220°C at saturated pressure and for the
reaction conditions that last for several hours. The process is accompanied by numerous reaction mechanisms such as hydrolysis, dehydration, decarboxylation, condensation polymerization, and aromatization, which are further discussed in Sections 5.2.1
through 5.2.4. These are not consecutive but parallel reaction paths, and the detailed
FiGUre 5.2 Comparison of H/C and O/C ratio variations for dry and wet pyrolysis processes
(HTC) for various feedstock. (From Libra, J., Ro, K., Kammann, C., Funke, A., Berge, N.,
Neubauer, Y., Titirici, M., Fuhner, C., Bens, O., and Emmerich, K., Biofuels, 2, 89–124, 2011.
With permission.)
H T C
Atomic ratio H/C (−)
2.0
1.5
1.0
0.5
0
0.75
0.25
0.5
Manure
Hydrochar
Hydrochar
Hydrochar
Charcoal
Cellulose
Wood
Bituminous
coal
Soft
lignite
Initial biomass
Atomic ratio O/C (−)
0.0
1.0
118
Water for Energy and Fuel Production
The solids produced from this process have been given many names such as char,
biocoal or biochar, or more accurately hydrochar to differentiate it from the char or
coal produced by the conventional dry pyrolysis. Significant reviews of hydrochar
have been published recently particularly on its production processes [18–28]. The
interest in hydrochar has increased very rapidly due to its connection to understand
natural coal formation [18–20,27], its use in creating new innovative materials [21],
and its application in soil quality improvement [22–28].
HTC can be an exothermic process, which lowers both oxygen and hydrogen content of the original feedstock mainly by dehydration and decarboxylation. The overall reaction identifying the heating value of the process can be expressed as [18–28]
C 6 H 12 O 5 → C 5.25 H 4 O 0.5 + 0.75CO 2 + 3H 2 O
(5.1)
The initial phase of this overall reaction, that is, hydrolysis of cellulose, is an e ndothermic
reaction [29]. As shown in Figure 5.2, this process is not as harsh as dry pyrolysis in the
reduction of hydrogen/carbon (H/C) and oxygen/carbon (O/C) ratios, and it produces
“coal-like” material, which can be similar to bituminous or sub- bituminous coals.
Typical effects of residence time and temperature on selected feedstock such as cellulose, peat bog, and wood are illustrated by Libra et al. [15]. Generally, the process
occurs in the temperature range of 180°C–220°C at saturated pressure and for the
reaction conditions that last for several hours. The process is accompanied by numerous reaction mechanisms such as hydrolysis, dehydration, decarboxylation, condensation polymerization, and aromatization, which are further discussed in Sections 5.2.1
through 5.2.4. These are not consecutive but parallel reaction paths, and the detailed
FiGUre 5.2 Comparison of H/C and O/C ratio variations for dry and wet pyrolysis processes
(HTC) for various feedstock. (From Libra, J., Ro, K., Kammann, C., Funke, A., Berge, N.,
Neubauer, Y., Titirici, M., Fuhner, C., Bens, O., and Emmerich, K., Biofuels, 2, 89–124, 2011.
With permission.)