

76
3 Experimental Techniques
3.7.1 DSC Measurement
Samples of 2–4 mg were weighed using a Perkin-Elmer microbalance (model AD2Z). The specimens were encapsulated in standard hermetically sealed aluminum
pans of 30 μL volume. For a typical DSC experiment, a sample and a reference pan
were placed in the DSC cell holders and were covered with platinum covers. For
crystallisation and melting experiments, the sample was heated to the upper extreme
temperature allocated and held isothermally until stable heat flow was observed.
Once a stable temperature was achieved, the sample was cooled from a melt at a
controlled rate to a lower temperature limit, usually 20 °C. Then it was followed by a
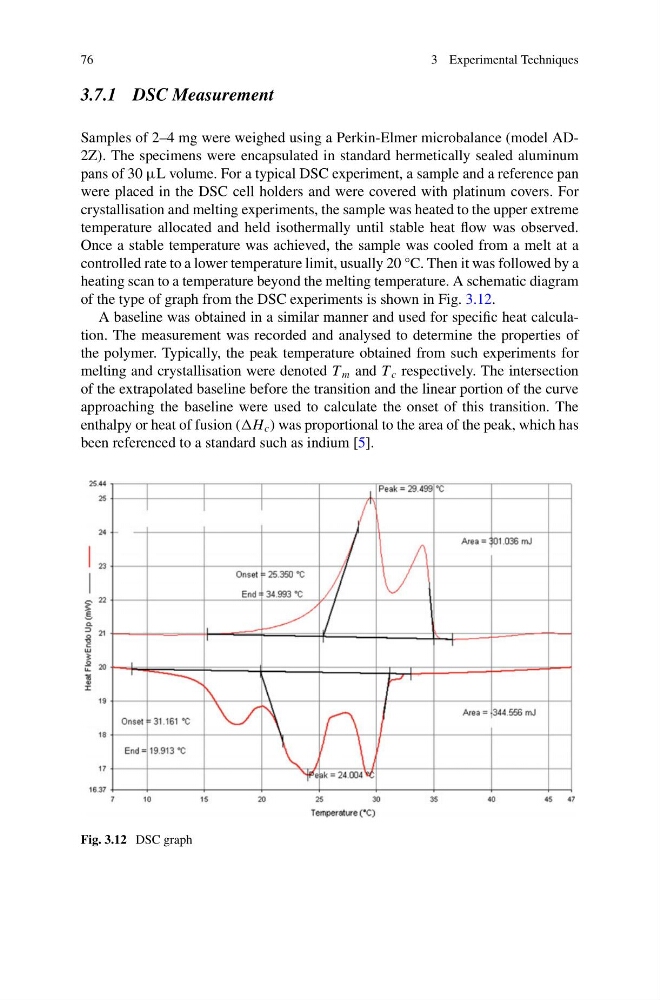
heating scan to a temperature beyond the melting temperature. A schematic diagram
of the type of graph from the DSC experiments is shown in Fig. 3.12.
A baseline was obtained in a similar manner and used for specific heat calculation. The measurement was recorded and analysed to determine the properties of
the polymer. Typically, the peak temperature obtained from such experiments for
melting and crystallisation were denoted T m and T c respectively. The intersection
of the extrapolated baseline before the transition and the linear portion of the curve
approaching the baseline were used to calculate the onset of this transition. The
enthalpy or heat of fusion (H c ) was proportional to the area of the peak, which has
been referenced to a standard such as indium [5].
Fig. 3.12 DSC graph
3 Experimental Techniques
3.7.1 DSC Measurement
Samples of 2–4 mg were weighed using a Perkin-Elmer microbalance (model AD2Z). The specimens were encapsulated in standard hermetically sealed aluminum
pans of 30 μL volume. For a typical DSC experiment, a sample and a reference pan
were placed in the DSC cell holders and were covered with platinum covers. For
crystallisation and melting experiments, the sample was heated to the upper extreme
temperature allocated and held isothermally until stable heat flow was observed.
Once a stable temperature was achieved, the sample was cooled from a melt at a
controlled rate to a lower temperature limit, usually 20 °C. Then it was followed by a
heating scan to a temperature beyond the melting temperature. A schematic diagram
of the type of graph from the DSC experiments is shown in Fig. 3.12.
A baseline was obtained in a similar manner and used for specific heat calculation. The measurement was recorded and analysed to determine the properties of
the polymer. Typically, the peak temperature obtained from such experiments for
melting and crystallisation were denoted T m and T c respectively. The intersection
of the extrapolated baseline before the transition and the linear portion of the curve
approaching the baseline were used to calculate the onset of this transition. The
enthalpy or heat of fusion (H c ) was proportional to the area of the peak, which has
been referenced to a standard such as indium [5].
Fig. 3.12 DSC graph