

4.5 Temperature Drop with PCM Materials
103
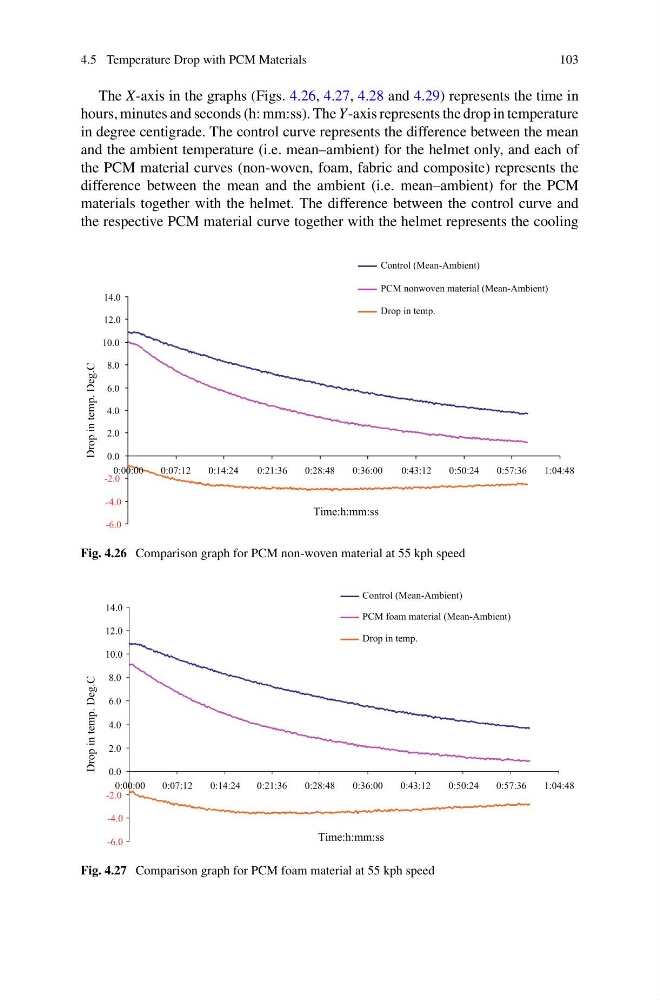
The X-axis in the graphs (Figs. 4.26, 4.27, 4.28 and 4.29) represents the time in
hours, minutes and seconds (h: mm:ss). The Y-axis represents the drop in temperature
in degree centigrade. The control curve represents the difference between the mean
and the ambient temperature (i.e. mean–ambient) for the helmet only, and each of
the PCM material curves (non-woven, foam, fabric and composite) represents the
difference between the mean and the ambient (i.e. mean–ambient) for the PCM
materials together with the helmet. The difference between the control curve and
the respective PCM material curve together with the helmet represents the cooling
Drop in temp. Deg.C
Control (Mean-Ambient)
14.0
12.0
PCM nonwoven material (Mean-Ambient)
Drop in temp.
10.0
8.0
6.0
4.0
2.0
0.0
0:00:00
0:07:12
0:14:24
0:21:36
0:28:48
0:36:00
0:43:12
0:50:24
0:57:36
1:04:48
-2.0
-4.0
-6.0
Time:h:mm:ss
Fig. 4.26 Comparison graph for PCM non-woven material at 55 kph speed
Drop in temp. Deg.C
14.0
12.0
10.0
Control (Mean-Ambient)
PCM foam material (Mean-Ambient)
Drop in temp.
8.0
6.0
4.0
2.0
0.0
0:00:00
0:07:12
0:14:24
0:21:36
0:28:48
0:36:00
0:43:12
0:50:24
0:57:36
1:04:48
-2.0
-4.0
-6.0
Time:h:mm:ss
Fig. 4.27 Comparison graph for PCM foam material at 55 kph speed
103
The X-axis in the graphs (Figs. 4.26, 4.27, 4.28 and 4.29) represents the time in
hours, minutes and seconds (h: mm:ss). The Y-axis represents the drop in temperature
in degree centigrade. The control curve represents the difference between the mean
and the ambient temperature (i.e. mean–ambient) for the helmet only, and each of
the PCM material curves (non-woven, foam, fabric and composite) represents the
difference between the mean and the ambient (i.e. mean–ambient) for the PCM
materials together with the helmet. The difference between the control curve and
the respective PCM material curve together with the helmet represents the cooling
Drop in temp. Deg.C
Control (Mean-Ambient)
14.0
12.0
PCM nonwoven material (Mean-Ambient)
Drop in temp.
10.0
8.0
6.0
4.0
2.0
0.0
0:00:00
0:07:12
0:14:24
0:21:36
0:28:48
0:36:00
0:43:12
0:50:24
0:57:36
1:04:48
-2.0
-4.0
-6.0
Time:h:mm:ss
Fig. 4.26 Comparison graph for PCM non-woven material at 55 kph speed
Drop in temp. Deg.C
14.0
12.0
10.0
Control (Mean-Ambient)
PCM foam material (Mean-Ambient)
Drop in temp.
8.0
6.0
4.0
2.0
0.0
0:00:00
0:07:12
0:14:24
0:21:36
0:28:48
0:36:00
0:43:12
0:50:24
0:57:36
1:04:48
-2.0
-4.0
-6.0
Time:h:mm:ss
Fig. 4.27 Comparison graph for PCM foam material at 55 kph speed