

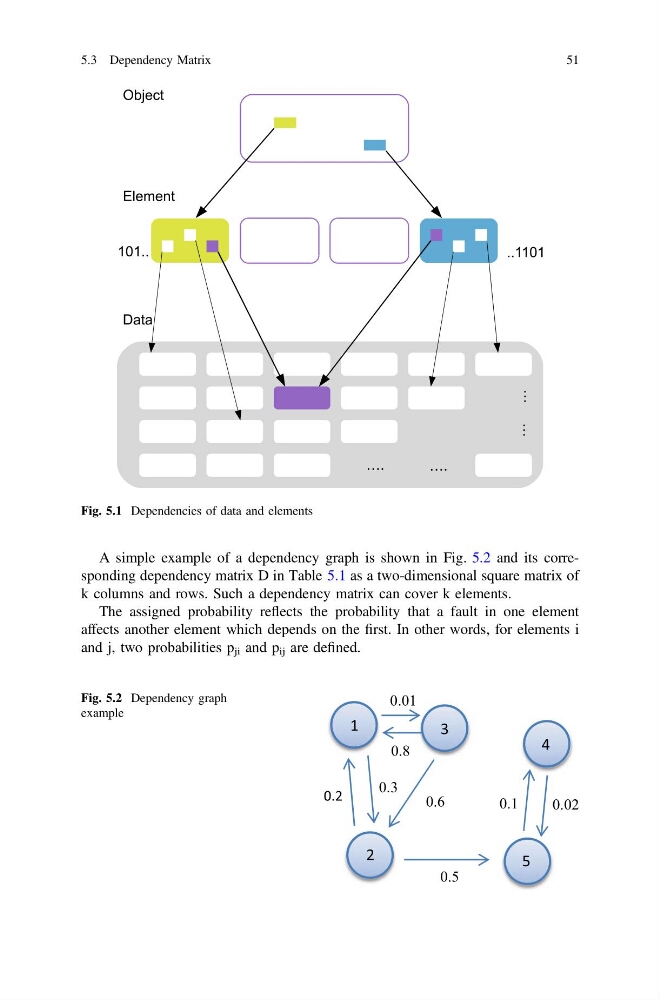
A simple example of a dependency graph is shown in Fig. 5.2 and its corresponding dependency matrix D in Table 5.1 as a two-dimensional square matrix of
k columns and rows. Such a dependency matrix can cover k elements.
The assigned probability reflects the probability that a fault in one element
affects another element which depends on the first. In other words, for elements i
and j, two probabilities p ji and p ij are defined.
Fig. 5.1 Dependencies of data and elements
0.5
0.2
0.3
0.6
0.01
0.8
0.1
0.02
1
3
4
2
5
Fig. 5.2 Dependency graph
example
5.3 Dependency Matrix
51
k columns and rows. Such a dependency matrix can cover k elements.
The assigned probability reflects the probability that a fault in one element
affects another element which depends on the first. In other words, for elements i
and j, two probabilities p ji and p ij are defined.
Fig. 5.1 Dependencies of data and elements
0.5
0.2
0.3
0.6
0.01
0.8
0.1
0.02
1
3
4
2
5
Fig. 5.2 Dependency graph
example
5.3 Dependency Matrix
51