

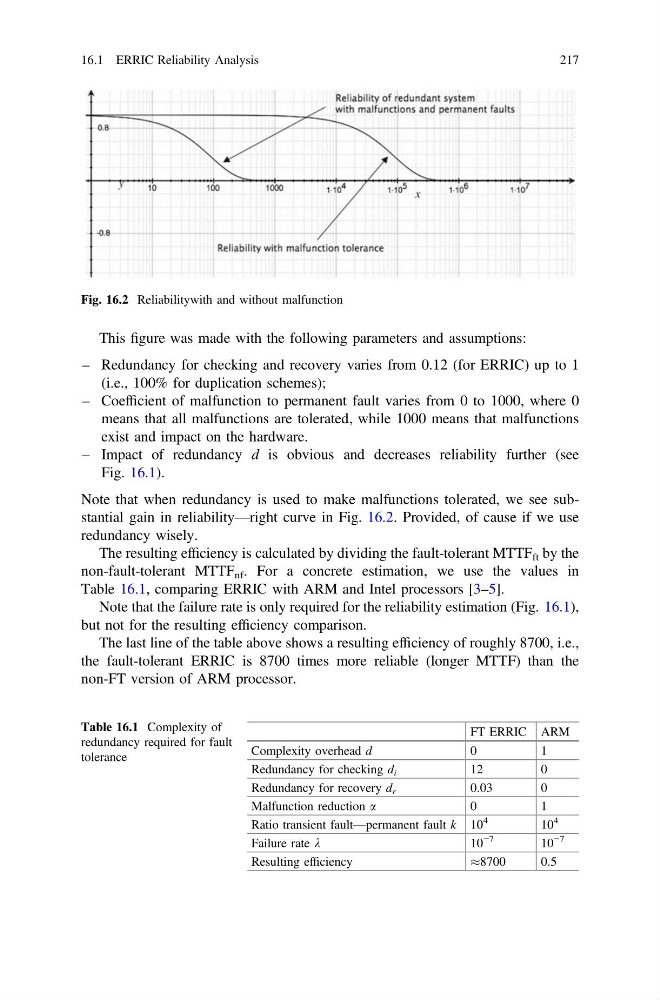
This figure was made with the following parameters and assumptions:
– Redundancy for checking and recovery varies from 0.12 (for ERRIC) up to 1
(i.e., 100% for duplication schemes);
– Coefficient of malfunction to permanent fault varies from 0 to 1000, where 0
means that all malfunctions are tolerated, while 1000 means that malfunctions
exist and impact on the hardware.
– Impact of redundancy d is obvious and decreases reliability further (see
Fig. 16.1).
Note that when redundancy is used to make malfunctions tolerated, we see substantial gain in reliability—right curve in Fig. 16.2. Provided, of cause if we use
redundancy wisely.
The resulting efficiency is calculated by dividing the fault-tolerant MTTF ft by the
non-fault-tolerant MTTF nf . For a concrete estimation, we use the values in
Table 16.1, comparing ERRIC with ARM and Intel processors [3–5].
Note that the failure rate is only required for the reliability estimation (Fig. 16.1),
but not for the resulting efficiency comparison.
The last line of the table above shows a resulting efficiency of roughly 8700, i.e.,
the fault-tolerant ERRIC is 8700 times more reliable (longer MTTF) than the
non-FT version of ARM processor.
Fig. 16.2 Reliabilitywith and without malfunction
Table 16.1 Complexity of
redundancy required for fault
tolerance
FT ERRIC ARM
Complexity overhead d
0
1
Redundancy for checking d i
12
0
Redundancy for recovery d r
0.03
0
Malfunction reduction a
0
1
Ratio transient fault—permanent fault k 10
4
10
4
Failure rate k
10
−7
10
−7
Resulting efficiency
%8700
0.5
16.1 ERRIC Reliability Analysis
217
– Redundancy for checking and recovery varies from 0.12 (for ERRIC) up to 1
(i.e., 100% for duplication schemes);
– Coefficient of malfunction to permanent fault varies from 0 to 1000, where 0
means that all malfunctions are tolerated, while 1000 means that malfunctions
exist and impact on the hardware.
– Impact of redundancy d is obvious and decreases reliability further (see
Fig. 16.1).
Note that when redundancy is used to make malfunctions tolerated, we see substantial gain in reliability—right curve in Fig. 16.2. Provided, of cause if we use
redundancy wisely.
The resulting efficiency is calculated by dividing the fault-tolerant MTTF ft by the
non-fault-tolerant MTTF nf . For a concrete estimation, we use the values in
Table 16.1, comparing ERRIC with ARM and Intel processors [3–5].
Note that the failure rate is only required for the reliability estimation (Fig. 16.1),
but not for the resulting efficiency comparison.
The last line of the table above shows a resulting efficiency of roughly 8700, i.e.,
the fault-tolerant ERRIC is 8700 times more reliable (longer MTTF) than the
non-FT version of ARM processor.
Fig. 16.2 Reliabilitywith and without malfunction
Table 16.1 Complexity of
redundancy required for fault
tolerance
FT ERRIC ARM
Complexity overhead d
0
1
Redundancy for checking d i
12
0
Redundancy for recovery d r
0.03
0
Malfunction reduction a
0
1
Ratio transient fault—permanent fault k 10
4
10
4
Failure rate k
10
−7
10
−7
Resulting efficiency
%8700
0.5
16.1 ERRIC Reliability Analysis
217