

146
7 Numerical Analysis of Macro-fiber Composite Structures
0
50
100
150
200
250
300
0
0.2
0.4
0.6
0.8
1
1.2
1.4
1.6
Distance from clamped edge (mm)
Vertical deflection (mm)
Front line
Central line
Back line
(a) MFC-d33 with fiber angle of 0
◦
0
50
100
150
200
250
300
−0.2
0
0.2
0.4
0.6
0.8
1
1.2
Distance from clamped edge (mm)
Vertical deflection (mm)
Front line
Central line
Back line
(b) MFC-d33 with fiber angle of 30
◦
0
50
100
150
200
250
300
−0.2
0
0.2
0.4
0.6
0.8
Distance from clamped edge (mm)
Vertical deflection (mm)
Front line
Central line
Back line
(c) MFC-d33 with fiber angle of 45
◦
0
50
100
150
200
250
300
−0.2
−0.1
0
0.1
0.2
0.3
0.4
0.5
0.6
Distance from clamped edge (mm)
Vertical deflection (mm)
Front line
Central line
Back line
(d) MFC-d33 with fiber angle of 60
◦
0
50
100
150
200
250
300
−0.25
−0.2
−0.15
−0.1
−0.05
0
0.05
0.1
0.15
Distance from clamped edge (mm)
Vertical deflection (mm)
Front line
Central line
Back line
(e) MFC-d33 with fiber angle of 75
◦
0
50
100
150
200
250
300
−0.25
−0.2
−0.15
−0.1
−0.05
0
0.05
Distance from clamped edge (mm)
Vertical deflection (mm)
Front line
Central line
Back line
(f) MFC-d33 with fiber angle of 90
◦
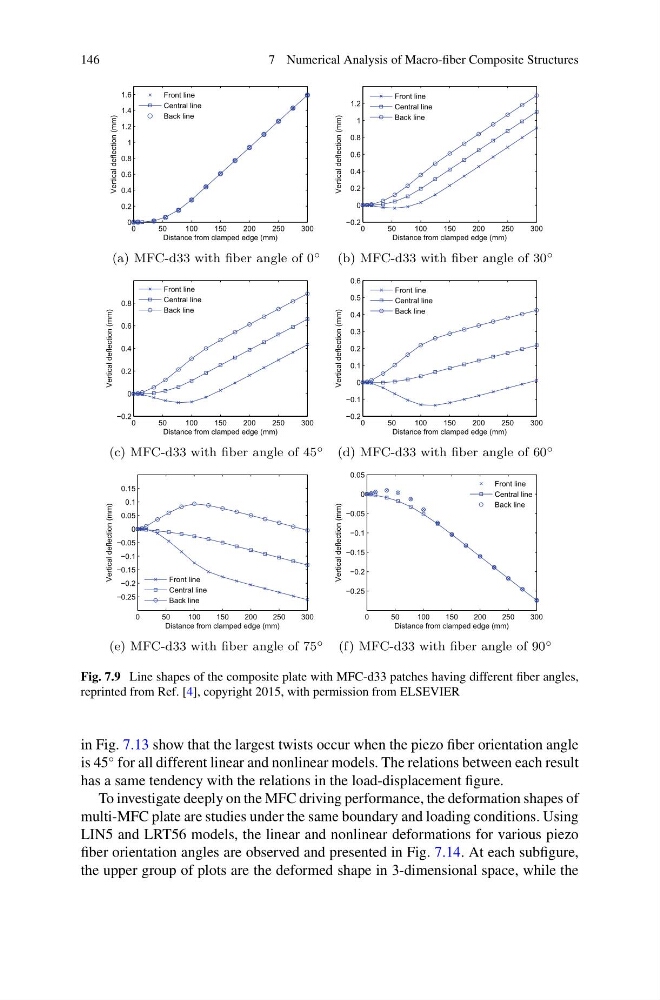
Fig. 7.9 Line shapes of the composite plate with MFC-d33 patches having different fiber angles,
reprinted from Ref. [4], copyright 2015, with permission from ELSEVIER
in Fig. 7.13 show that the largest twists occur when the piezo fiber orientation angle
is 45
◦ for all different linear and nonlinear models. The relations between each result
has a same tendency with the relations in the load-displacement figure.
To investigate deeply on the MFC driving performance, the deformation shapes of
multi-MFC plate are studies under the same boundary and loading conditions. Using
LIN5 and LRT56 models, the linear and nonlinear deformations for various piezo
fiber orientation angles are observed and presented in Fig. 7.14. At each subfigure,
the upper group of plots are the deformed shape in 3-dimensional space, while the
7 Numerical Analysis of Macro-fiber Composite Structures
0
50
100
150
200
250
300
0
0.2
0.4
0.6
0.8
1
1.2
1.4
1.6
Distance from clamped edge (mm)
Vertical deflection (mm)
Front line
Central line
Back line
(a) MFC-d33 with fiber angle of 0
◦
0
50
100
150
200
250
300
−0.2
0
0.2
0.4
0.6
0.8
1
1.2
Distance from clamped edge (mm)
Vertical deflection (mm)
Front line
Central line
Back line
(b) MFC-d33 with fiber angle of 30
◦
0
50
100
150
200
250
300
−0.2
0
0.2
0.4
0.6
0.8
Distance from clamped edge (mm)
Vertical deflection (mm)
Front line
Central line
Back line
(c) MFC-d33 with fiber angle of 45
◦
0
50
100
150
200
250
300
−0.2
−0.1
0
0.1
0.2
0.3
0.4
0.5
0.6
Distance from clamped edge (mm)
Vertical deflection (mm)
Front line
Central line
Back line
(d) MFC-d33 with fiber angle of 60
◦
0
50
100
150
200
250
300
−0.25
−0.2
−0.15
−0.1
−0.05
0
0.05
0.1
0.15
Distance from clamped edge (mm)
Vertical deflection (mm)
Front line
Central line
Back line
(e) MFC-d33 with fiber angle of 75
◦
0
50
100
150
200
250
300
−0.25
−0.2
−0.15
−0.1
−0.05
0
0.05
Distance from clamped edge (mm)
Vertical deflection (mm)
Front line
Central line
Back line
(f) MFC-d33 with fiber angle of 90
◦
Fig. 7.9 Line shapes of the composite plate with MFC-d33 patches having different fiber angles,
reprinted from Ref. [4], copyright 2015, with permission from ELSEVIER
in Fig. 7.13 show that the largest twists occur when the piezo fiber orientation angle
is 45
◦ for all different linear and nonlinear models. The relations between each result
has a same tendency with the relations in the load-displacement figure.
To investigate deeply on the MFC driving performance, the deformation shapes of
multi-MFC plate are studies under the same boundary and loading conditions. Using
LIN5 and LRT56 models, the linear and nonlinear deformations for various piezo
fiber orientation angles are observed and presented in Fig. 7.14. At each subfigure,
the upper group of plots are the deformed shape in 3-dimensional space, while the