

140
7 Numerical Analysis of Macro-fiber Composite Structures
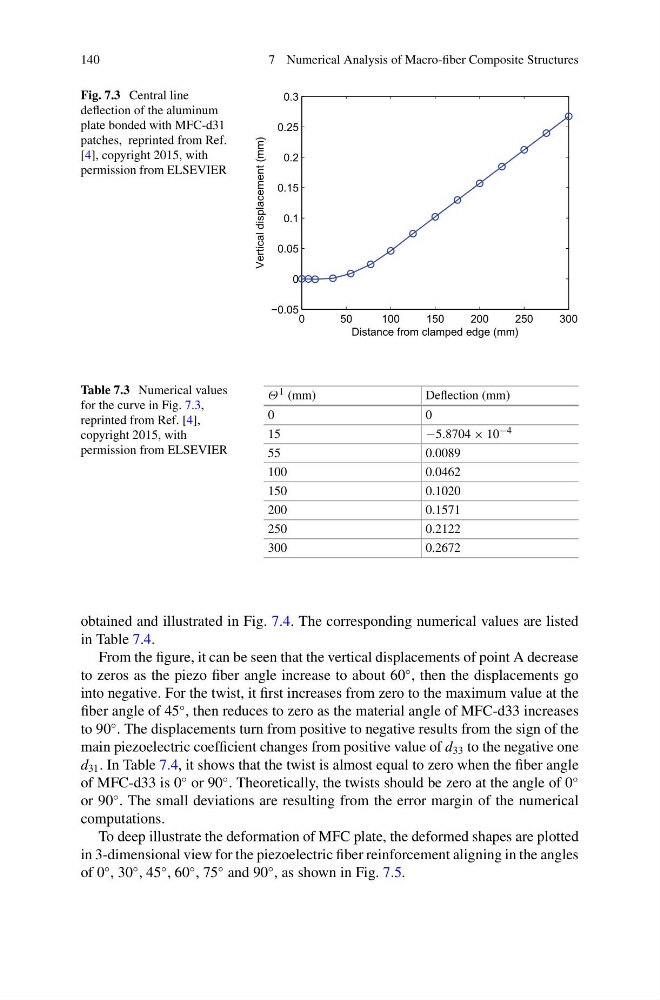
Fig. 7.3 Central line
deflection of the aluminum
plate bonded with MFC-d31
patches, reprinted from Ref.
[4], copyright 2015, with
permission from ELSEVIER
0
50
100
150
200
250
300
−0.05
0
0.05
0.1
0.15
0.2
0.25
0.3
Distance from clamped edge (mm)
Vertical displacement (mm)
Table 7.3 Numerical values
for the curve in Fig. 7.3,
reprinted from Ref. [4],
copyright 2015, with
permission from ELSEVIER
Θ 1 (mm)
Deflection (mm)
0
0
15
−5.8704 × 10 −4
55
0.0089
100
0.0462
150
0.1020
200
0.1571
250
0.2122
300
0.2672
obtained and illustrated in Fig. 7.4. The corresponding numerical values are listed
in Table 7.4.
From the figure, it can be seen that the vertical displacements of point A decrease
to zeros as the piezo fiber angle increase to about 60
◦ , then the displacements go
into negative. For the twist, it first increases from zero to the maximum value at the
fiber angle of 45
◦ , then reduces to zero as the material angle of MFC-d33 increases
to 90
◦ . The displacements turn from positive to negative results from the sign of the
main piezoelectric coefficient changes from positive value of d 33 to the negative one
d 31 . In Table 7.4, it shows that the twist is almost equal to zero when the fiber angle
of MFC-d33 is 0
◦ or 90
◦ . Theoretically, the twists should be zero at the angle of 0
◦
or 90
◦ . The small deviations are resulting from the error margin of the numerical
computations.
To deep illustrate the deformation of MFC plate, the deformed shapes are plotted
in 3-dimensional view for the piezoelectric fiber reinforcement aligning in the angles
of 0
◦ , 30
◦ , 45
◦ , 60
◦ , 75
◦ and 90
◦ , as shown in Fig. 7.5.
7 Numerical Analysis of Macro-fiber Composite Structures
Fig. 7.3 Central line
deflection of the aluminum
plate bonded with MFC-d31
patches, reprinted from Ref.
[4], copyright 2015, with
permission from ELSEVIER
0
50
100
150
200
250
300
−0.05
0
0.05
0.1
0.15
0.2
0.25
0.3
Distance from clamped edge (mm)
Vertical displacement (mm)
Table 7.3 Numerical values
for the curve in Fig. 7.3,
reprinted from Ref. [4],
copyright 2015, with
permission from ELSEVIER
Θ 1 (mm)
Deflection (mm)
0
0
15
−5.8704 × 10 −4
55
0.0089
100
0.0462
150
0.1020
200
0.1571
250
0.2122
300
0.2672
obtained and illustrated in Fig. 7.4. The corresponding numerical values are listed
in Table 7.4.
From the figure, it can be seen that the vertical displacements of point A decrease
to zeros as the piezo fiber angle increase to about 60
◦ , then the displacements go
into negative. For the twist, it first increases from zero to the maximum value at the
fiber angle of 45
◦ , then reduces to zero as the material angle of MFC-d33 increases
to 90
◦ . The displacements turn from positive to negative results from the sign of the
main piezoelectric coefficient changes from positive value of d 33 to the negative one
d 31 . In Table 7.4, it shows that the twist is almost equal to zero when the fiber angle
of MFC-d33 is 0
◦ or 90
◦ . Theoretically, the twists should be zero at the angle of 0
◦
or 90
◦ . The small deviations are resulting from the error margin of the numerical
computations.
To deep illustrate the deformation of MFC plate, the deformed shapes are plotted
in 3-dimensional view for the piezoelectric fiber reinforcement aligning in the angles
of 0
◦ , 30
◦ , 45
◦ , 60
◦ , 75
◦ and 90
◦ , as shown in Fig. 7.5.