

where
k Motor energy conversion rate;
b Total energy efficiency of energy transfer link.
(3) Analysis of simulation results
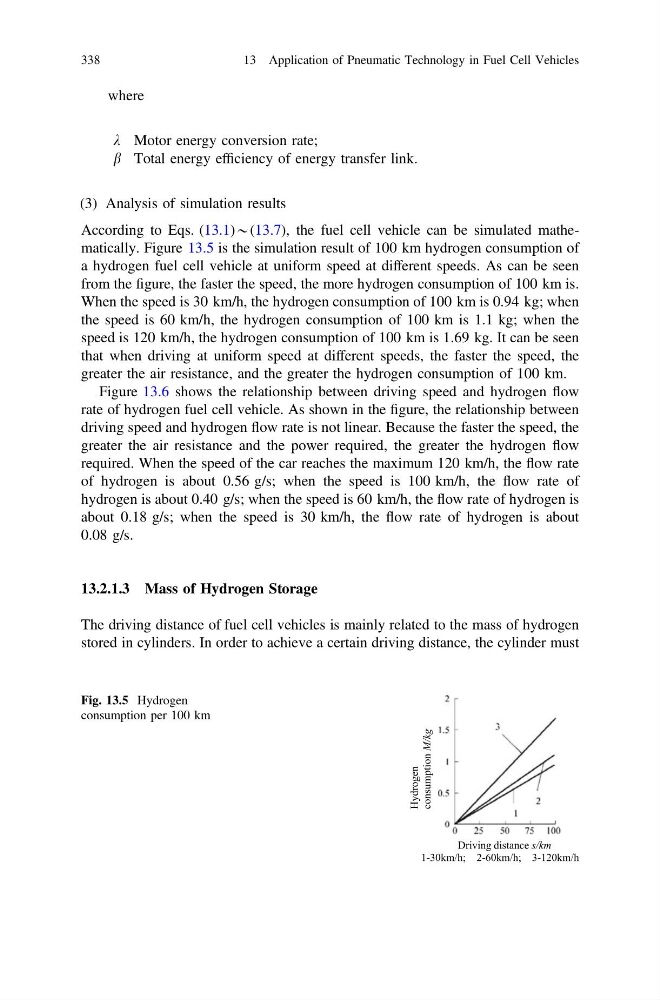
According to Eqs. (13.1)*(13.7), the fuel cell vehicle can be simulated mathematically. Figure 13.5 is the simulation result of 100 km hydrogen consumption of
a hydrogen fuel cell vehicle at uniform speed at different speeds. As can be seen
from the figure, the faster the speed, the more hydrogen consumption of 100 km is.
When the speed is 30 km/h, the hydrogen consumption of 100 km is 0.94 kg; when
the speed is 60 km/h, the hydrogen consumption of 100 km is 1.1 kg; when the
speed is 120 km/h, the hydrogen consumption of 100 km is 1.69 kg. It can be seen
that when driving at uniform speed at different speeds, the faster the speed, the
greater the air resistance, and the greater the hydrogen consumption of 100 km.
Figure 13.6 shows the relationship between driving speed and hydrogen flow
rate of hydrogen fuel cell vehicle. As shown in the figure, the relationship between
driving speed and hydrogen flow rate is not linear. Because the faster the speed, the
greater the air resistance and the power required, the greater the hydrogen flow
required. When the speed of the car reaches the maximum 120 km/h, the flow rate
of hydrogen is about 0.56 g/s; when the speed is 100 km/h, the flow rate of
hydrogen is about 0.40 g/s; when the speed is 60 km/h, the flow rate of hydrogen is
about 0.18 g/s; when the speed is 30 km/h, the flow rate of hydrogen is about
0.08 g/s.
13.2.1.3 Mass of Hydrogen Storage
The driving distance of fuel cell vehicles is mainly related to the mass of hydrogen
stored in cylinders. In order to achieve a certain driving distance, the cylinder must
Driving distance s/km
1-30km/h; 2-60km/h; 3-120km/h
Hydrogen
consumption M/kg
Fig. 13.5 Hydrogen
consumption per 100 km
338
13 Application of Pneumatic Technology in Fuel Cell Vehicles
k Motor energy conversion rate;
b Total energy efficiency of energy transfer link.
(3) Analysis of simulation results
According to Eqs. (13.1)*(13.7), the fuel cell vehicle can be simulated mathematically. Figure 13.5 is the simulation result of 100 km hydrogen consumption of
a hydrogen fuel cell vehicle at uniform speed at different speeds. As can be seen
from the figure, the faster the speed, the more hydrogen consumption of 100 km is.
When the speed is 30 km/h, the hydrogen consumption of 100 km is 0.94 kg; when
the speed is 60 km/h, the hydrogen consumption of 100 km is 1.1 kg; when the
speed is 120 km/h, the hydrogen consumption of 100 km is 1.69 kg. It can be seen
that when driving at uniform speed at different speeds, the faster the speed, the
greater the air resistance, and the greater the hydrogen consumption of 100 km.
Figure 13.6 shows the relationship between driving speed and hydrogen flow
rate of hydrogen fuel cell vehicle. As shown in the figure, the relationship between
driving speed and hydrogen flow rate is not linear. Because the faster the speed, the
greater the air resistance and the power required, the greater the hydrogen flow
required. When the speed of the car reaches the maximum 120 km/h, the flow rate
of hydrogen is about 0.56 g/s; when the speed is 100 km/h, the flow rate of
hydrogen is about 0.40 g/s; when the speed is 60 km/h, the flow rate of hydrogen is
about 0.18 g/s; when the speed is 30 km/h, the flow rate of hydrogen is about
0.08 g/s.
13.2.1.3 Mass of Hydrogen Storage
The driving distance of fuel cell vehicles is mainly related to the mass of hydrogen
stored in cylinders. In order to achieve a certain driving distance, the cylinder must
Driving distance s/km
1-30km/h; 2-60km/h; 3-120km/h
Hydrogen
consumption M/kg
Fig. 13.5 Hydrogen
consumption per 100 km
338
13 Application of Pneumatic Technology in Fuel Cell Vehicles