

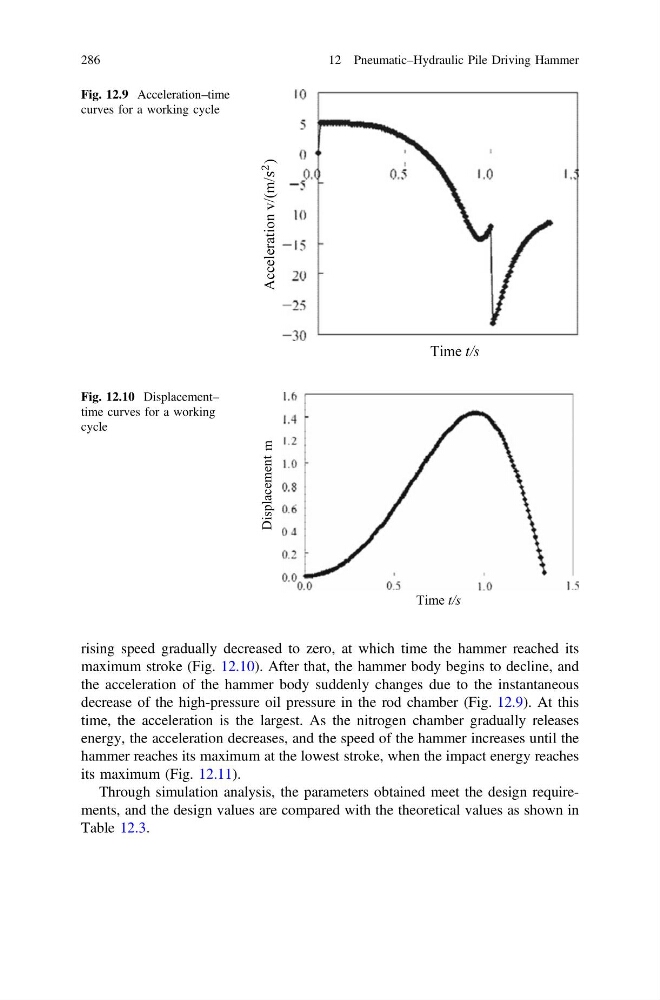
rising speed gradually decreased to zero, at which time the hammer reached its
maximum stroke (Fig. 12.10). After that, the hammer body begins to decline, and
the acceleration of the hammer body suddenly changes due to the instantaneous
decrease of the high-pressure oil pressure in the rod chamber (Fig. 12.9). At this
time, the acceleration is the largest. As the nitrogen chamber gradually releases
energy, the acceleration decreases, and the speed of the hammer increases until the
hammer reaches its maximum at the lowest stroke, when the impact energy reaches
its maximum (Fig. 12.11).
Through simulation analysis, the parameters obtained meet the design requirements, and the design values are compared with the theoretical values as shown in
Table 12.3.
Time t/s
Acceleration v/(m/s
2
)
Fig. 12.9 Acceleration–time
curves for a working cycle
Time t/s
Displacement
m
Fig. 12.10 Displacement–
time curves for a working
cycle
286
12 Pneumatic–Hydraulic Pile Driving Hammer
maximum stroke (Fig. 12.10). After that, the hammer body begins to decline, and
the acceleration of the hammer body suddenly changes due to the instantaneous
decrease of the high-pressure oil pressure in the rod chamber (Fig. 12.9). At this
time, the acceleration is the largest. As the nitrogen chamber gradually releases
energy, the acceleration decreases, and the speed of the hammer increases until the
hammer reaches its maximum at the lowest stroke, when the impact energy reaches
its maximum (Fig. 12.11).
Through simulation analysis, the parameters obtained meet the design requirements, and the design values are compared with the theoretical values as shown in
Table 12.3.
Time t/s
Acceleration v/(m/s
2
)
Fig. 12.9 Acceleration–time
curves for a working cycle
Time t/s
Displacement
m
Fig. 12.10 Displacement–
time curves for a working
cycle
286
12 Pneumatic–Hydraulic Pile Driving Hammer