

whole hydraulic system, so only the cartridge valve model of two reversing valves
is established on the platform.
According to the design requirements, some important parameters can be calculated, such as hammer body mass and stroke, piston rod diameter, strike frequency, etc. For those that cannot be calculated directly, a rough value is obtained
by consulting the relevant design criteria, and then the model is run in batches and
revised repeatedly. Finally, a set of parameters to meet the design requirements are
determined: the maximum working pressure of the system is 32 MPa; the maximum flow rate of the hydraulic pump is 1400 L=min; the inflatable pressure of the
high-pressure accumulator is 15 MPa; the nominal volume is 96 L; the
low-pressure accumulator inflatable pressure is 0.5 MPa; the nominal volume is 64
L; the hammer core mass is 30 t; the piston diameter is 230 mm; the piston rod
diameter is 180 mm; the nitrogen chamber initial volume is 75 L; the nitrogen
chamber preload pressure is 16 MPa; the rising time is 1 s; and the falling time is
0.34 s.
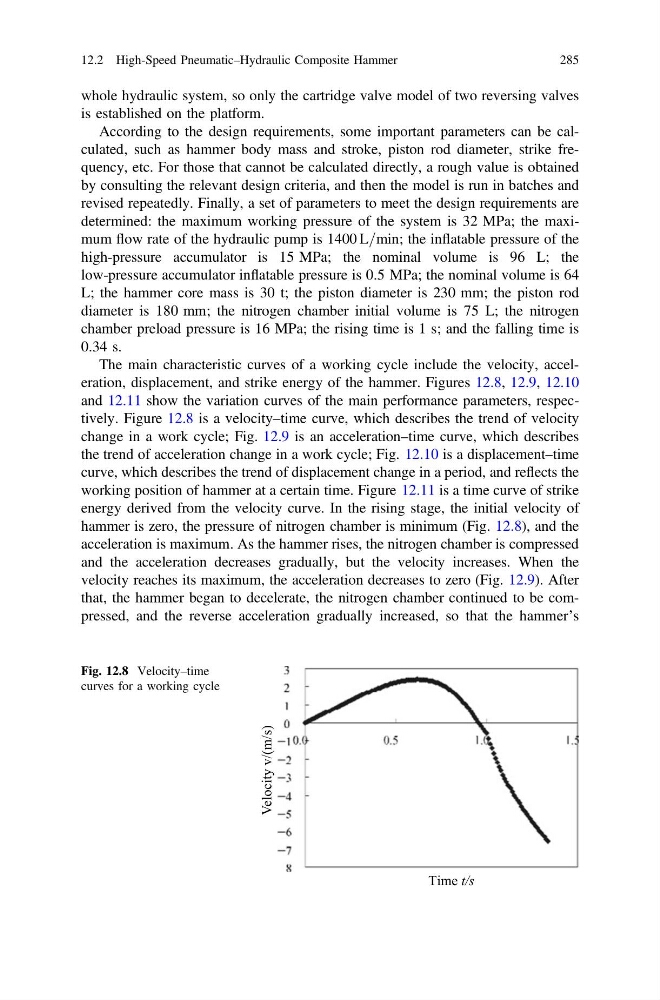
The main characteristic curves of a working cycle include the velocity, acceleration, displacement, and strike energy of the hammer. Figures 12.8, 12.9, 12.10
and 12.11 show the variation curves of the main performance parameters, respectively. Figure 12.8 is a velocity–time curve, which describes the trend of velocity
change in a work cycle; Fig. 12.9 is an acceleration–time curve, which describes
the trend of acceleration change in a work cycle; Fig. 12.10 is a displacement–time
curve, which describes the trend of displacement change in a period, and reflects the
working position of hammer at a certain time. Figure 12.11 is a time curve of strike
energy derived from the velocity curve. In the rising stage, the initial velocity of
hammer is zero, the pressure of nitrogen chamber is minimum (Fig. 12.8), and the
acceleration is maximum. As the hammer rises, the nitrogen chamber is compressed
and the acceleration decreases gradually, but the velocity increases. When the
velocity reaches its maximum, the acceleration decreases to zero (Fig. 12.9). After
that, the hammer began to decelerate, the nitrogen chamber continued to be compressed, and the reverse acceleration gradually increased, so that the hammer’s
Time t/s
Velocity v/(m/s)
Fig. 12.8 Velocity–time
curves for a working cycle
12.2 High-Speed Pneumatic–Hydraulic Composite Hammer
285
is established on the platform.
According to the design requirements, some important parameters can be calculated, such as hammer body mass and stroke, piston rod diameter, strike frequency, etc. For those that cannot be calculated directly, a rough value is obtained
by consulting the relevant design criteria, and then the model is run in batches and
revised repeatedly. Finally, a set of parameters to meet the design requirements are
determined: the maximum working pressure of the system is 32 MPa; the maximum flow rate of the hydraulic pump is 1400 L=min; the inflatable pressure of the
high-pressure accumulator is 15 MPa; the nominal volume is 96 L; the
low-pressure accumulator inflatable pressure is 0.5 MPa; the nominal volume is 64
L; the hammer core mass is 30 t; the piston diameter is 230 mm; the piston rod
diameter is 180 mm; the nitrogen chamber initial volume is 75 L; the nitrogen
chamber preload pressure is 16 MPa; the rising time is 1 s; and the falling time is
0.34 s.
The main characteristic curves of a working cycle include the velocity, acceleration, displacement, and strike energy of the hammer. Figures 12.8, 12.9, 12.10
and 12.11 show the variation curves of the main performance parameters, respectively. Figure 12.8 is a velocity–time curve, which describes the trend of velocity
change in a work cycle; Fig. 12.9 is an acceleration–time curve, which describes
the trend of acceleration change in a work cycle; Fig. 12.10 is a displacement–time
curve, which describes the trend of displacement change in a period, and reflects the
working position of hammer at a certain time. Figure 12.11 is a time curve of strike
energy derived from the velocity curve. In the rising stage, the initial velocity of
hammer is zero, the pressure of nitrogen chamber is minimum (Fig. 12.8), and the
acceleration is maximum. As the hammer rises, the nitrogen chamber is compressed
and the acceleration decreases gradually, but the velocity increases. When the
velocity reaches its maximum, the acceleration decreases to zero (Fig. 12.9). After
that, the hammer began to decelerate, the nitrogen chamber continued to be compressed, and the reverse acceleration gradually increased, so that the hammer’s
Time t/s
Velocity v/(m/s)
Fig. 12.8 Velocity–time
curves for a working cycle
12.2 High-Speed Pneumatic–Hydraulic Composite Hammer
285