

B k h m
n
ra e t er al efficie cy, %
23
22
21
20
19
18
20
25
1000 rpm
2000
3000
4000
0
5
10
15
30
Ethanol, %
Ethanol
139
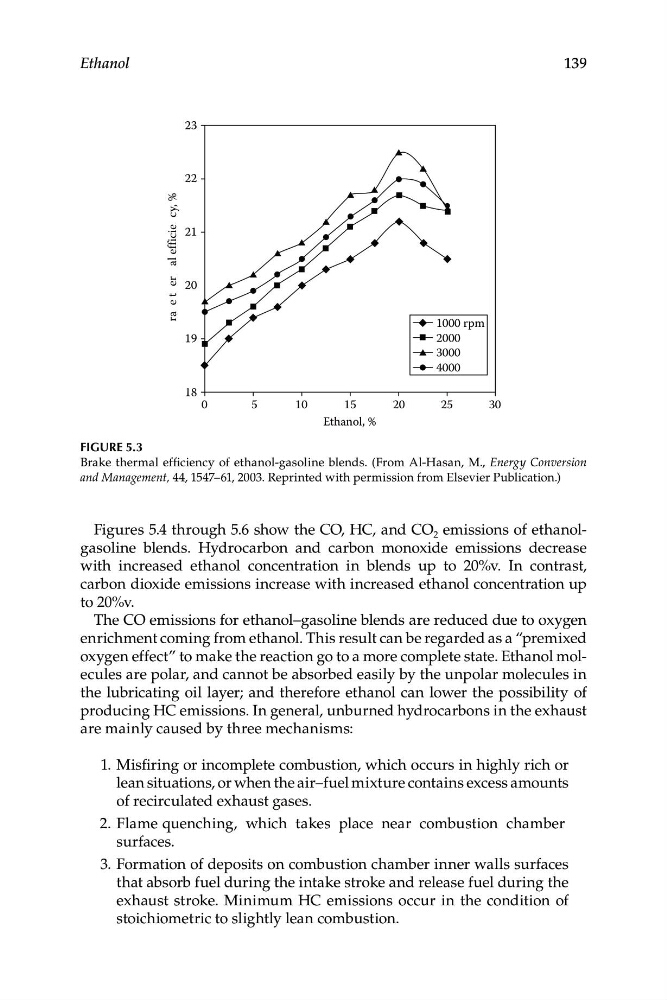
Figure 5.3
Brake thermal efficiency of ethanol-gasoline blends. (From Al-Hasan, M., Energy Conversion
and Management, 44, 1547–61, 2003. Reprinted with permission from Elsevier Publication.)
Figures 5.4 through 5.6 show the CO, HC, and CO 2 emissions of ethanolgasoline blends. Hydrocarbon and carbon monoxide emissions decrease
with increased ethanol concentration in blends up to 20%v. In contrast,
carbon dioxide emissions increase with increased ethanol concentration up
to 20%v.
The CO emissions for ethanol–gasoline blends are reduced due to oxygen
enrichment coming from ethanol. This result can be regarded as a “premixed
oxygen effect” to make the reaction go to a more complete state. Ethanol molecules are polar, and cannot be absorbed easily by the unpolar molecules in
the lubricating oil layer; and therefore ethanol can lower the possibility of
producing HC emissions. In general, unburned hydrocarbons in the exhaust
are mainly caused by three mechanisms:
1. Misfiring or incomplete combustion, which occurs in highly rich or
lean situations, or when the air–fuel mixture contains excess amounts
of recirculated exhaust gases.
2. Flame quenching, which takes place near combustion chamber
surfaces.
3. Formation of deposits on combustion chamber inner walls surfaces
that absorb fuel during the intake stroke and release fuel during the
exhaust stroke. Minimum HC emissions occur in the condition of
stoichiometric to slightly lean combustion.
n
ra e t er al efficie cy, %
23
22
21
20
19
18
20
25
1000 rpm
2000
3000
4000
0
5
10
15
30
Ethanol, %
Ethanol
139
Figure 5.3
Brake thermal efficiency of ethanol-gasoline blends. (From Al-Hasan, M., Energy Conversion
and Management, 44, 1547–61, 2003. Reprinted with permission from Elsevier Publication.)
Figures 5.4 through 5.6 show the CO, HC, and CO 2 emissions of ethanolgasoline blends. Hydrocarbon and carbon monoxide emissions decrease
with increased ethanol concentration in blends up to 20%v. In contrast,
carbon dioxide emissions increase with increased ethanol concentration up
to 20%v.
The CO emissions for ethanol–gasoline blends are reduced due to oxygen
enrichment coming from ethanol. This result can be regarded as a “premixed
oxygen effect” to make the reaction go to a more complete state. Ethanol molecules are polar, and cannot be absorbed easily by the unpolar molecules in
the lubricating oil layer; and therefore ethanol can lower the possibility of
producing HC emissions. In general, unburned hydrocarbons in the exhaust
are mainly caused by three mechanisms:
1. Misfiring or incomplete combustion, which occurs in highly rich or
lean situations, or when the air–fuel mixture contains excess amounts
of recirculated exhaust gases.
2. Flame quenching, which takes place near combustion chamber
surfaces.
3. Formation of deposits on combustion chamber inner walls surfaces
that absorb fuel during the intake stroke and release fuel during the
exhaust stroke. Minimum HC emissions occur in the condition of
stoichiometric to slightly lean combustion.