

Methanol
103
The fuel’s chemical energy is not fully released inside the engine during
the combustion process. Therefore, it is useful to compare the combustion
efficiencies of the test fuels used in the engine. Canakci, Sayin, and Gumus
(2008) also compared the combustion efficiencies of methanol-blended diesel
fuels to M0. The results showed that the combustion efficiency increased
with increasing methanol ratio in the fuel blend at all engine loads and injection timings. When methanol is added into diesel fuel, the fuel contains more
oxygen, which reduces CO and UHC emissions and increases NO x emissions. These effects caused an increase in combustion efficiency. Combustion
efficiency slightly increased with an increasing engine load from 5 to 20 Nm
for all test fuels because of better volumetric efficiency and atomization rate.
The increase in combustion efficiency with advancing the injection timing
was attributed to increases in the NO x emissions and decreases in CO and
UHC emissions, as mentioned below.
At this point, it is good to mention the change in exhaust temperature
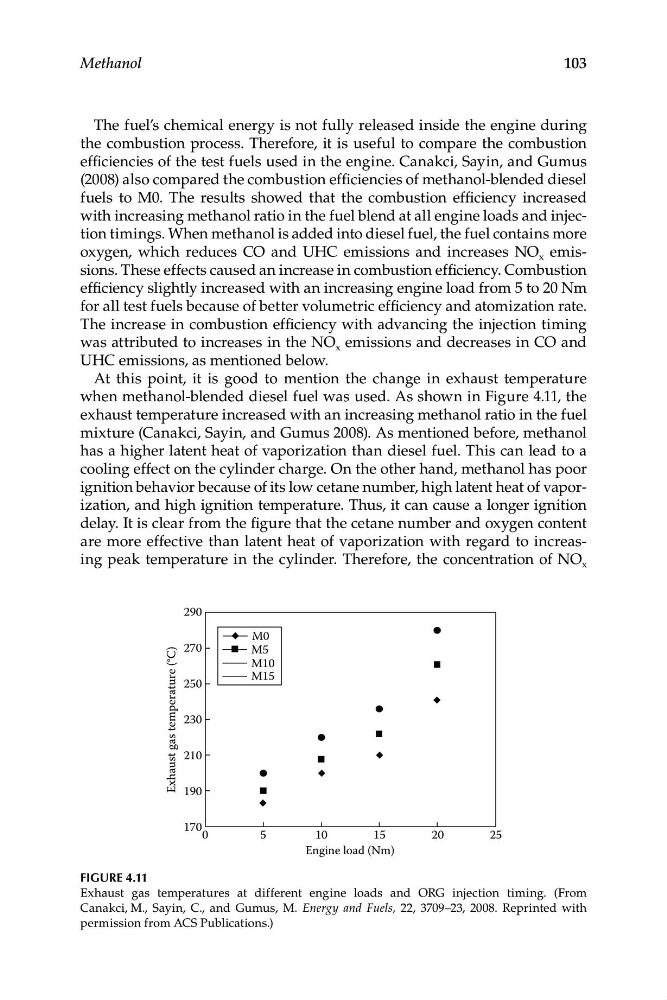
when methanol-blended diesel fuel was used. As shown in Figure 4.11, the
exhaust temperature increased with an increasing methanol ratio in the fuel
mixture (Canakci, Sayin, and Gumus 2008). As mentioned before, methanol
has a higher latent heat of vaporization than diesel fuel. This can lead to a
cooling effect on the cylinder charge. On the other hand, methanol has poor
ignition behavior because of its low cetane number, high latent heat of vaporization, and high ignition temperature. Thus, it can cause a longer ignition
delay. It is clear from the figure that the cetane number and oxygen content
are more effective than latent heat of vaporization with regard to increasing peak temperature in the cylinder. Therefore, the concentration of NO x
0
5
10
15
20
25
Engine load (Nm)
290
270
M0
M5
M10
M15
250
230
210
190
170
Exhaust gas temperature (°C)
Figure 4.11
Exhaust gas temperatures at different engine loads and ORG injection timing. (From
Canakci, M., Sayin, C., and Gumus, M. Energy and Fuels, 22, 3709–23, 2008. Reprinted with
permission from ACS Publications.)
103
The fuel’s chemical energy is not fully released inside the engine during
the combustion process. Therefore, it is useful to compare the combustion
efficiencies of the test fuels used in the engine. Canakci, Sayin, and Gumus
(2008) also compared the combustion efficiencies of methanol-blended diesel
fuels to M0. The results showed that the combustion efficiency increased
with increasing methanol ratio in the fuel blend at all engine loads and injection timings. When methanol is added into diesel fuel, the fuel contains more
oxygen, which reduces CO and UHC emissions and increases NO x emissions. These effects caused an increase in combustion efficiency. Combustion
efficiency slightly increased with an increasing engine load from 5 to 20 Nm
for all test fuels because of better volumetric efficiency and atomization rate.
The increase in combustion efficiency with advancing the injection timing
was attributed to increases in the NO x emissions and decreases in CO and
UHC emissions, as mentioned below.
At this point, it is good to mention the change in exhaust temperature
when methanol-blended diesel fuel was used. As shown in Figure 4.11, the
exhaust temperature increased with an increasing methanol ratio in the fuel
mixture (Canakci, Sayin, and Gumus 2008). As mentioned before, methanol
has a higher latent heat of vaporization than diesel fuel. This can lead to a
cooling effect on the cylinder charge. On the other hand, methanol has poor
ignition behavior because of its low cetane number, high latent heat of vaporization, and high ignition temperature. Thus, it can cause a longer ignition
delay. It is clear from the figure that the cetane number and oxygen content
are more effective than latent heat of vaporization with regard to increasing peak temperature in the cylinder. Therefore, the concentration of NO x
0
5
10
15
20
25
Engine load (Nm)
290
270
M0
M5
M10
M15
250
230
210
190
170
Exhaust gas temperature (°C)
Figure 4.11
Exhaust gas temperatures at different engine loads and ORG injection timing. (From
Canakci, M., Sayin, C., and Gumus, M. Energy and Fuels, 22, 3709–23, 2008. Reprinted with
permission from ACS Publications.)