

68
S. A. Khan et al.
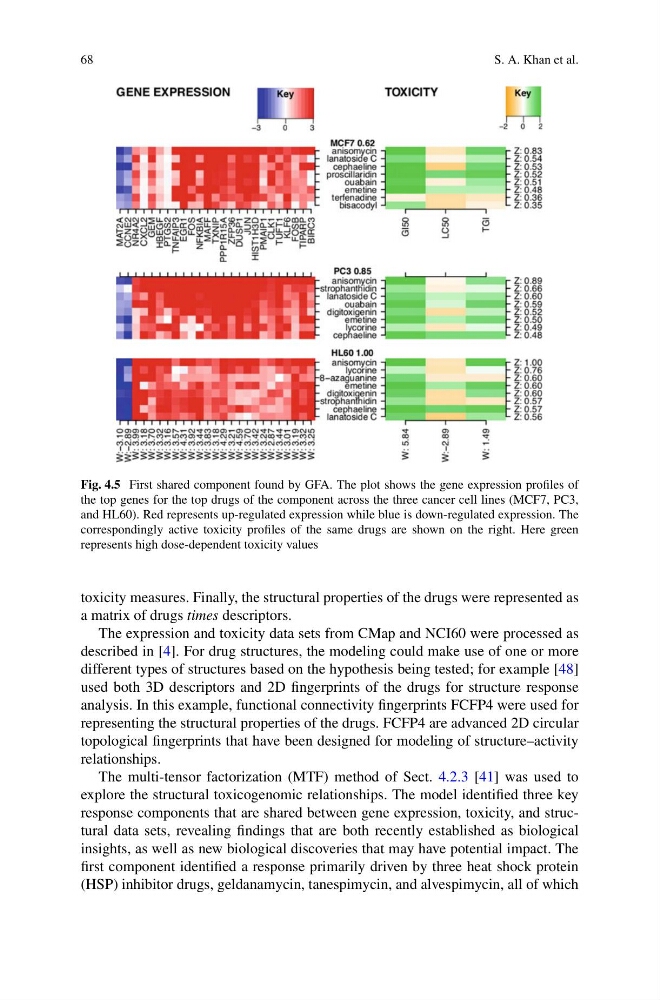
Fig. 4.5 First shared component found by GFA. The plot shows the gene expression profiles of
the top genes for the top drugs of the component across the three cancer cell lines (MCF7, PC3,
and HL60). Red represents up-regulated expression while blue is down-regulated expression. The
correspondingly active toxicity profiles of the same drugs are shown on the right. Here green
represents high dose-dependent toxicity values
toxicity measures. Finally, the structural properties of the drugs were represented as
a matrix of drugs times descriptors.
The expression and toxicity data sets from CMap and NCI60 were processed as
described in [4]. For drug structures, the modeling could make use of one or more
different types of structures based on the hypothesis being tested; for example [48]
used both 3D descriptors and 2D fingerprints of the drugs for structure response
analysis. In this example, functional connectivity fingerprints FCFP4 were used for
representing the structural properties of the drugs. FCFP4 are advanced 2D circular
topological fingerprints that have been designed for modeling of structure–activity
relationships.
The multi-tensor factorization (MTF) method of Sect. 4.2.3 [41] was used to
explore the structural toxicogenomic relationships. The model identified three key
response components that are shared between gene expression, toxicity, and structural data sets, revealing findings that are both recently established as biological
insights, as well as new biological discoveries that may have potential impact. The
first component identified a response primarily driven by three heat shock protein
(HSP) inhibitor drugs, geldanamycin, tanespimycin, and alvespimycin, all of which
S. A. Khan et al.
Fig. 4.5 First shared component found by GFA. The plot shows the gene expression profiles of
the top genes for the top drugs of the component across the three cancer cell lines (MCF7, PC3,
and HL60). Red represents up-regulated expression while blue is down-regulated expression. The
correspondingly active toxicity profiles of the same drugs are shown on the right. Here green
represents high dose-dependent toxicity values
toxicity measures. Finally, the structural properties of the drugs were represented as
a matrix of drugs times descriptors.
The expression and toxicity data sets from CMap and NCI60 were processed as
described in [4]. For drug structures, the modeling could make use of one or more
different types of structures based on the hypothesis being tested; for example [48]
used both 3D descriptors and 2D fingerprints of the drugs for structure response
analysis. In this example, functional connectivity fingerprints FCFP4 were used for
representing the structural properties of the drugs. FCFP4 are advanced 2D circular
topological fingerprints that have been designed for modeling of structure–activity
relationships.
The multi-tensor factorization (MTF) method of Sect. 4.2.3 [41] was used to
explore the structural toxicogenomic relationships. The model identified three key
response components that are shared between gene expression, toxicity, and structural data sets, revealing findings that are both recently established as biological
insights, as well as new biological discoveries that may have potential impact. The
first component identified a response primarily driven by three heat shock protein
(HSP) inhibitor drugs, geldanamycin, tanespimycin, and alvespimycin, all of which