

4 Matrix and Tensor Factorization Methods …
67
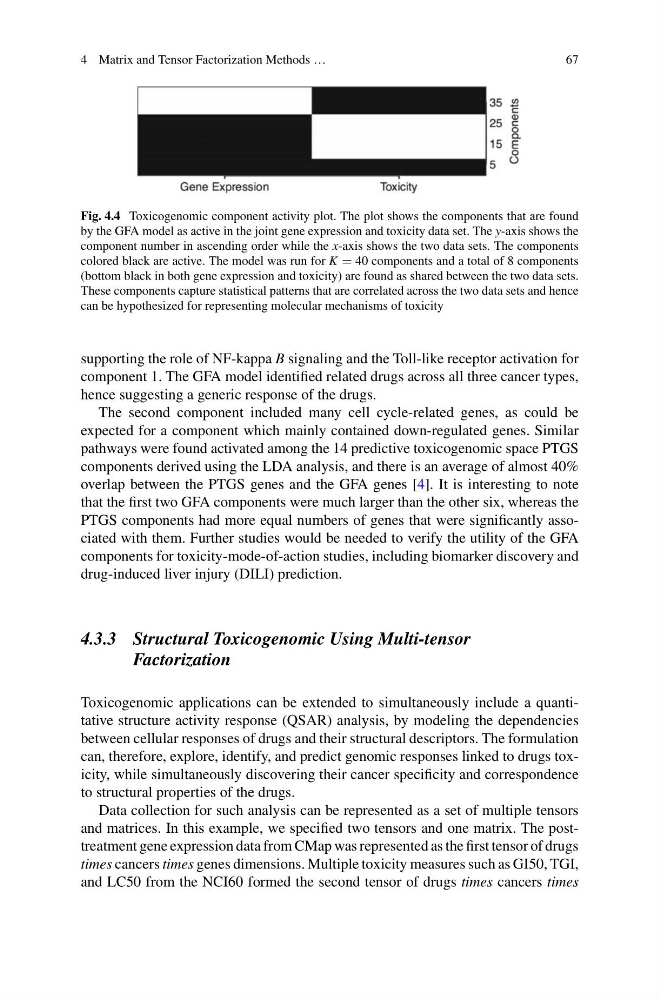
Fig. 4.4 Toxicogenomic component activity plot. The plot shows the components that are found
by the GFA model as active in the joint gene expression and toxicity data set. The y-axis shows the
component number in ascending order while the x-axis shows the two data sets. The components
colored black are active. The model was run for K = 40 components and a total of 8 components
(bottom black in both gene expression and toxicity) are found as shared between the two data sets.
These components capture statistical patterns that are correlated across the two data sets and hence
can be hypothesized for representing molecular mechanisms of toxicity
supporting the role of NF-kappa B signaling and the Toll-like receptor activation for
component 1. The GFA model identified related drugs across all three cancer types,
hence suggesting a generic response of the drugs.
The second component included many cell cycle-related genes, as could be
expected for a component which mainly contained down-regulated genes. Similar
pathways were found activated among the 14 predictive toxicogenomic space PTGS
components derived using the LDA analysis, and there is an average of almost 40%
overlap between the PTGS genes and the GFA genes [4]. It is interesting to note
that the first two GFA components were much larger than the other six, whereas the
PTGS components had more equal numbers of genes that were significantly associated with them. Further studies would be needed to verify the utility of the GFA
components for toxicity-mode-of-action studies, including biomarker discovery and
drug-induced liver injury (DILI) prediction.
4.3.3 Structural Toxicogenomic Using Multi-tensor
Factorization
Toxicogenomic applications can be extended to simultaneously include a quantitative structure activity response (QSAR) analysis, by modeling the dependencies
between cellular responses of drugs and their structural descriptors. The formulation
can, therefore, explore, identify, and predict genomic responses linked to drugs toxicity, while simultaneously discovering their cancer specificity and correspondence
to structural properties of the drugs.
Data collection for such analysis can be represented as a set of multiple tensors
and matrices. In this example, we specified two tensors and one matrix. The posttreatment gene expression data from CMap was represented as the first tensor of drugs
times cancers times genes dimensions. Multiple toxicity measures such as GI50, TGI,
and LC50 from the NCI60 formed the second tensor of drugs times cancers times
67
Fig. 4.4 Toxicogenomic component activity plot. The plot shows the components that are found
by the GFA model as active in the joint gene expression and toxicity data set. The y-axis shows the
component number in ascending order while the x-axis shows the two data sets. The components
colored black are active. The model was run for K = 40 components and a total of 8 components
(bottom black in both gene expression and toxicity) are found as shared between the two data sets.
These components capture statistical patterns that are correlated across the two data sets and hence
can be hypothesized for representing molecular mechanisms of toxicity
supporting the role of NF-kappa B signaling and the Toll-like receptor activation for
component 1. The GFA model identified related drugs across all three cancer types,
hence suggesting a generic response of the drugs.
The second component included many cell cycle-related genes, as could be
expected for a component which mainly contained down-regulated genes. Similar
pathways were found activated among the 14 predictive toxicogenomic space PTGS
components derived using the LDA analysis, and there is an average of almost 40%
overlap between the PTGS genes and the GFA genes [4]. It is interesting to note
that the first two GFA components were much larger than the other six, whereas the
PTGS components had more equal numbers of genes that were significantly associated with them. Further studies would be needed to verify the utility of the GFA
components for toxicity-mode-of-action studies, including biomarker discovery and
drug-induced liver injury (DILI) prediction.
4.3.3 Structural Toxicogenomic Using Multi-tensor
Factorization
Toxicogenomic applications can be extended to simultaneously include a quantitative structure activity response (QSAR) analysis, by modeling the dependencies
between cellular responses of drugs and their structural descriptors. The formulation
can, therefore, explore, identify, and predict genomic responses linked to drugs toxicity, while simultaneously discovering their cancer specificity and correspondence
to structural properties of the drugs.
Data collection for such analysis can be represented as a set of multiple tensors
and matrices. In this example, we specified two tensors and one matrix. The posttreatment gene expression data from CMap was represented as the first tensor of drugs
times cancers times genes dimensions. Multiple toxicity measures such as GI50, TGI,
and LC50 from the NCI60 formed the second tensor of drugs times cancers times