

13 Predicting the Risks of Drug-Induced Liver Injury …
269
Besides the QSAR model for predicting two classes of DILI risk, we also developed another model to assess the three classes of DILI risk (i.e., most-DILI, lessDILI, and no-DILI) [68]. The model was developed by using decision forest (DF)
and Mold2 structural descriptors together with DILIrank dataset with >1000 drugs
evaluated for their likelihood of causing DILI in humans, of which >700 drugs were
classified into three categories used for the model development. Similarly, with two
classes of QSAR model, the three-class models were evaluated via cross-validations,
bootstrapping validations, and permutation tests for assessing the potential chance
correlation. Moreover, prediction confidence analysis was also conducted to provide an additional interpretation of prediction results. These results indicated that
the 3-class model showed higher accuracy in differentiating most-DILI drugs from
no-DILI drugs than the 2-class DILI model with a potential to categorize DILI risk
into a higher resolution.
13.3.4 Modified QSAR Models
Besides developing conventional QSAR models based on chemical structure information only, we also tried to incorporate other drug information, especially those
related to DILI-relevant biological functions, to improve model performance. For
instance, understanding the mode of action (MOA) of a drug is critical in safety
assessment. Therefore, it is promising to improve the predictive model by considering MOA of drugs on DILI. To achieve that, we have developed an algorithm named
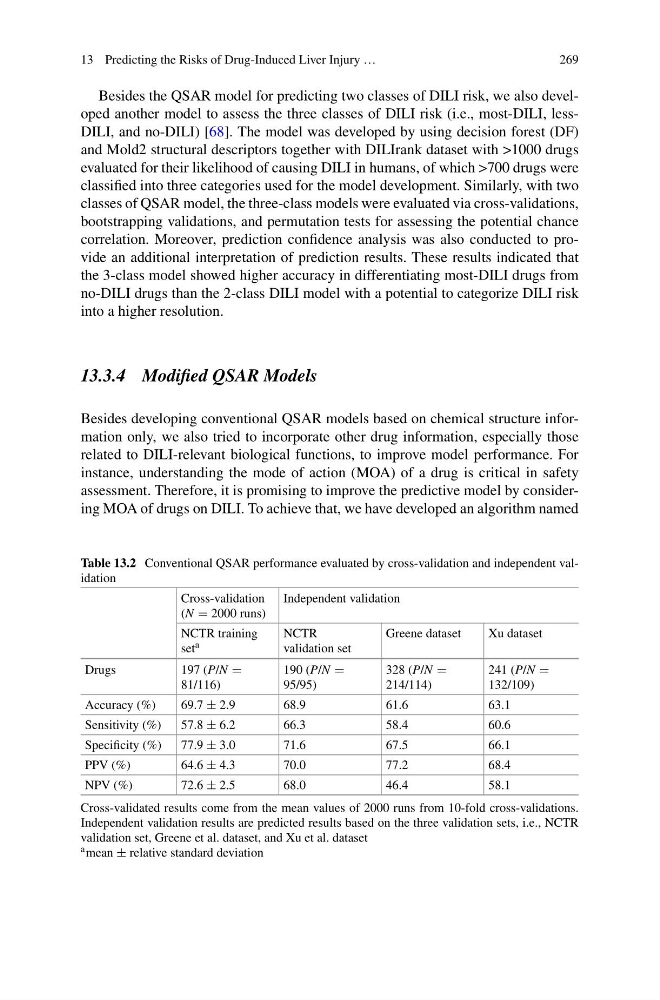
Table 13.2 Conventional QSAR performance evaluated by cross-validation and independent validation
Cross-validation
(N = 2000 runs)
Independent validation
NCTR training
set a
NCTR
validation set
Greene dataset
Xu dataset
Drugs
197 (P/N =
81/116)
190 (P/N =
95/95)
328 (P/N =
214/114)
241 (P/N =
132/109)
Accuracy (%)
69.7 ± 2.9
68.9
61.6
63.1
Sensitivity (%)
57.8 ± 6.2
66.3
58.4
60.6
Specificity (%)
77.9 ± 3.0
71.6
67.5
66.1
PPV (%)
64.6 ± 4.3
70.0
77.2
68.4
NPV (%)
72.6 ± 2.5
68.0
46.4
58.1
Cross-validated results come from the mean values of 2000 runs from 10-fold cross-validations.
Independent validation results are predicted results based on the three validation sets, i.e., NCTR
validation set, Greene et al. dataset, and Xu et al. dataset
a mean ± relative standard deviation
269
Besides the QSAR model for predicting two classes of DILI risk, we also developed another model to assess the three classes of DILI risk (i.e., most-DILI, lessDILI, and no-DILI) [68]. The model was developed by using decision forest (DF)
and Mold2 structural descriptors together with DILIrank dataset with >1000 drugs
evaluated for their likelihood of causing DILI in humans, of which >700 drugs were
classified into three categories used for the model development. Similarly, with two
classes of QSAR model, the three-class models were evaluated via cross-validations,
bootstrapping validations, and permutation tests for assessing the potential chance
correlation. Moreover, prediction confidence analysis was also conducted to provide an additional interpretation of prediction results. These results indicated that
the 3-class model showed higher accuracy in differentiating most-DILI drugs from
no-DILI drugs than the 2-class DILI model with a potential to categorize DILI risk
into a higher resolution.
13.3.4 Modified QSAR Models
Besides developing conventional QSAR models based on chemical structure information only, we also tried to incorporate other drug information, especially those
related to DILI-relevant biological functions, to improve model performance. For
instance, understanding the mode of action (MOA) of a drug is critical in safety
assessment. Therefore, it is promising to improve the predictive model by considering MOA of drugs on DILI. To achieve that, we have developed an algorithm named
Table 13.2 Conventional QSAR performance evaluated by cross-validation and independent validation
Cross-validation
(N = 2000 runs)
Independent validation
NCTR training
set a
NCTR
validation set
Greene dataset
Xu dataset
Drugs
197 (P/N =
81/116)
190 (P/N =
95/95)
328 (P/N =
214/114)
241 (P/N =
132/109)
Accuracy (%)
69.7 ± 2.9
68.9
61.6
63.1
Sensitivity (%)
57.8 ± 6.2
66.3
58.4
60.6
Specificity (%)
77.9 ± 3.0
71.6
67.5
66.1
PPV (%)
64.6 ± 4.3
70.0
77.2
68.4
NPV (%)
72.6 ± 2.5
68.0
46.4
58.1
Cross-validated results come from the mean values of 2000 runs from 10-fold cross-validations.
Independent validation results are predicted results based on the three validation sets, i.e., NCTR
validation set, Greene et al. dataset, and Xu et al. dataset
a mean ± relative standard deviation