

3 Study on Improving the Performance of Nitinol Cardiovascular Stent …
35
dross, surface morphology and energy spectrum analysis of the stent. The Thermofly
250xi X-ray photoelectron spectroscopy (XPS) was used to analyze the chemical
composition and content of the stent after laser cutting.
3.3 Results and Discussions
3.3.1 Surface Image and Morphology
The image of the stent after laser cutting is shown in Fig. 3.1b. There was burn at
the kerf of the stent surface, and the burn was more serious at the corner of the
cutting route because the energy density at the turning point was large. This also
shows that microsecond laser processing is still hot processing, and the heat plays
a major role in the damage of the stent. As can be seen from Fig. 3.5a, the SEM
photo of the stent surface after laser cutting also showed that the surface of the stent
was uneven with grooves and the colors were not uniform. The surface image of
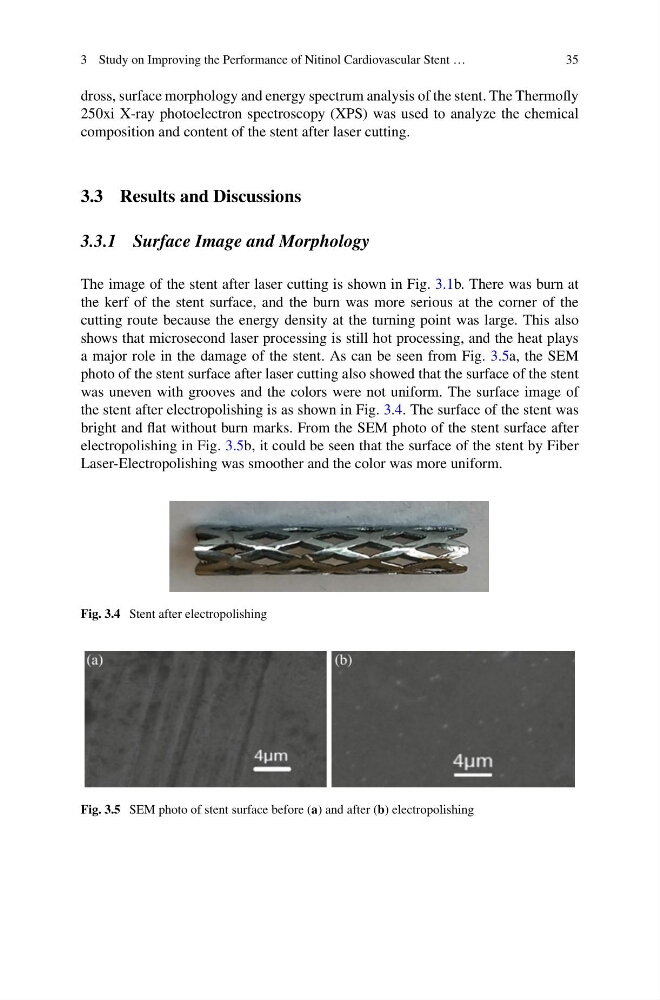
the stent after electropolishing is as shown in Fig. 3.4. The surface of the stent was
bright and flat without burn marks. From the SEM photo of the stent surface after
electropolishing in Fig. 3.5b, it could be seen that the surface of the stent by Fiber
Laser-Electropolishing was smoother and the color was more uniform.
Fig. 3.4 Stent after electropolishing
Fig. 3.5 SEM photo of stent surface before (a) and after (b) electropolishing
35
dross, surface morphology and energy spectrum analysis of the stent. The Thermofly
250xi X-ray photoelectron spectroscopy (XPS) was used to analyze the chemical
composition and content of the stent after laser cutting.
3.3 Results and Discussions
3.3.1 Surface Image and Morphology
The image of the stent after laser cutting is shown in Fig. 3.1b. There was burn at
the kerf of the stent surface, and the burn was more serious at the corner of the
cutting route because the energy density at the turning point was large. This also
shows that microsecond laser processing is still hot processing, and the heat plays
a major role in the damage of the stent. As can be seen from Fig. 3.5a, the SEM
photo of the stent surface after laser cutting also showed that the surface of the stent
was uneven with grooves and the colors were not uniform. The surface image of
the stent after electropolishing is as shown in Fig. 3.4. The surface of the stent was
bright and flat without burn marks. From the SEM photo of the stent surface after
electropolishing in Fig. 3.5b, it could be seen that the surface of the stent by Fiber
Laser-Electropolishing was smoother and the color was more uniform.
Fig. 3.4 Stent after electropolishing
Fig. 3.5 SEM photo of stent surface before (a) and after (b) electropolishing