

2 Peridynamic Simulation for Thermal and Mechanical Behavior …
23
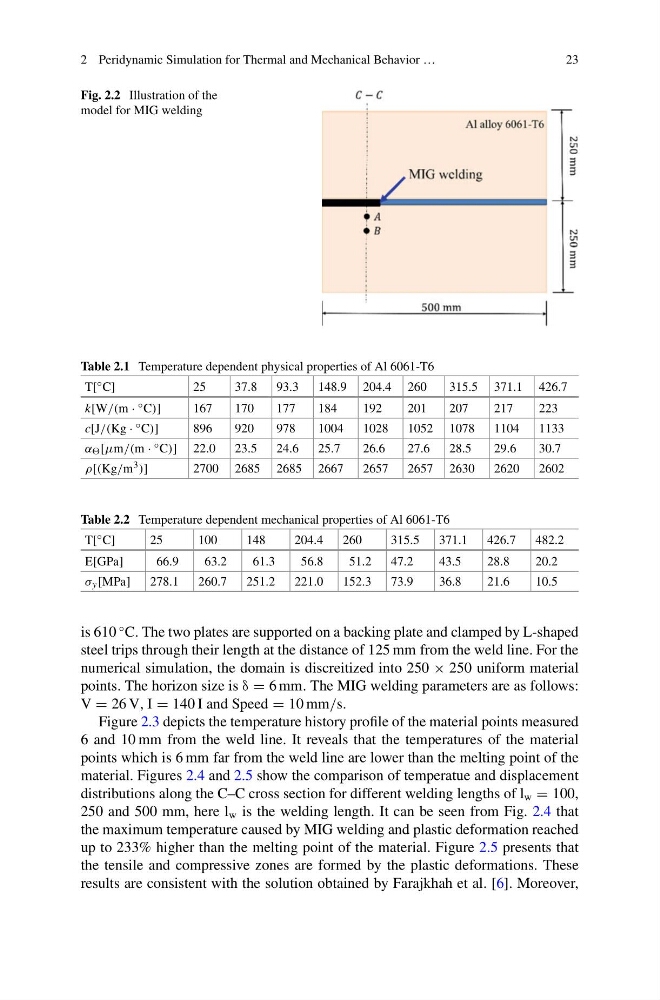
Fig. 2.2 Illustration of the
model for MIG welding
Table 2.1 Temperature dependent physical properties of Al 6061-T6
T[ ◦ C]
25
37.8
93.3
148.9 204.4 260
315.5 371.1 426.7
k[W/(m · ◦ C)]
167
170
177
184
192
201
207
217
223
c[J/(Kg · ◦ C)]
896
920
978
1004
1028
1052 1078
1104
1133
α [μm/(m · ◦ C)] 22.0
23.5
24.6
25.7
26.6
27.6
28.5
29.6
30.7
ρ[(Kg/m 3 )]
2700 2685 2685 2667
2657
2657 2630
2620
2602
Table 2.2 Temperature dependent mechanical properties of Al 6061-T6
T[ ◦ C]
25
100
148
204.4
260
315.5
371.1
426.7
482.2
E[GPa]
66.9
63.2
61.3
56.8
51.2
47.2
43.5
28.8
20.2
σ y [MPa]
278.1
260.7
251.2
221.0
152.3
73.9
36.8
21.6
10.5
is 610
◦ C. The two plates are supported on a backing plate and clamped by L-shaped
steel trips through their length at the distance of 125 mm from the weld line. For the
numerical simulation, the domain is discreitized into 250 × 250 uniform material
points. The horizon size is δ = 6 mm. The MIG welding parameters are as follows:
V = 26 V, I = 140 I and Speed = 10 mm/s.
Figure 2.3 depicts the temperature history profile of the material points measured
6 and 10 mm from the weld line. It reveals that the temperatures of the material
points which is 6 mm far from the weld line are lower than the melting point of the
material. Figures 2.4 and 2.5 show the comparison of temperatue and displacement
distributions along the C–C cross section for different welding lengths of l w = 100,
250 and 500 mm, here l w is the welding length. It can be seen from Fig. 2.4 that
the maximum temperature caused by MIG welding and plastic deformation reached
up to 233% higher than the melting point of the material. Figure 2.5 presents that
the tensile and compressive zones are formed by the plastic deformations. These
results are consistent with the solution obtained by Farajkhah et al. [6]. Moreover,
23
Fig. 2.2 Illustration of the
model for MIG welding
Table 2.1 Temperature dependent physical properties of Al 6061-T6
T[ ◦ C]
25
37.8
93.3
148.9 204.4 260
315.5 371.1 426.7
k[W/(m · ◦ C)]
167
170
177
184
192
201
207
217
223
c[J/(Kg · ◦ C)]
896
920
978
1004
1028
1052 1078
1104
1133
α [μm/(m · ◦ C)] 22.0
23.5
24.6
25.7
26.6
27.6
28.5
29.6
30.7
ρ[(Kg/m 3 )]
2700 2685 2685 2667
2657
2657 2630
2620
2602
Table 2.2 Temperature dependent mechanical properties of Al 6061-T6
T[ ◦ C]
25
100
148
204.4
260
315.5
371.1
426.7
482.2
E[GPa]
66.9
63.2
61.3
56.8
51.2
47.2
43.5
28.8
20.2
σ y [MPa]
278.1
260.7
251.2
221.0
152.3
73.9
36.8
21.6
10.5
is 610
◦ C. The two plates are supported on a backing plate and clamped by L-shaped
steel trips through their length at the distance of 125 mm from the weld line. For the
numerical simulation, the domain is discreitized into 250 × 250 uniform material
points. The horizon size is δ = 6 mm. The MIG welding parameters are as follows:
V = 26 V, I = 140 I and Speed = 10 mm/s.
Figure 2.3 depicts the temperature history profile of the material points measured
6 and 10 mm from the weld line. It reveals that the temperatures of the material
points which is 6 mm far from the weld line are lower than the melting point of the
material. Figures 2.4 and 2.5 show the comparison of temperatue and displacement
distributions along the C–C cross section for different welding lengths of l w = 100,
250 and 500 mm, here l w is the welding length. It can be seen from Fig. 2.4 that
the maximum temperature caused by MIG welding and plastic deformation reached
up to 233% higher than the melting point of the material. Figure 2.5 presents that
the tensile and compressive zones are formed by the plastic deformations. These
results are consistent with the solution obtained by Farajkhah et al. [6]. Moreover,