

192
S. Ruan et al.
0
500
1000
1500
2000
0
100
200
300
400
500
600
700
800
900
1000
Heat capacity (Jkg
-1
K
-1
)
Temperture ( C)
Capacity
0
10
20
30
40
50
Conductivity
Heat
conductivity (Wm
-1
K
-1
)
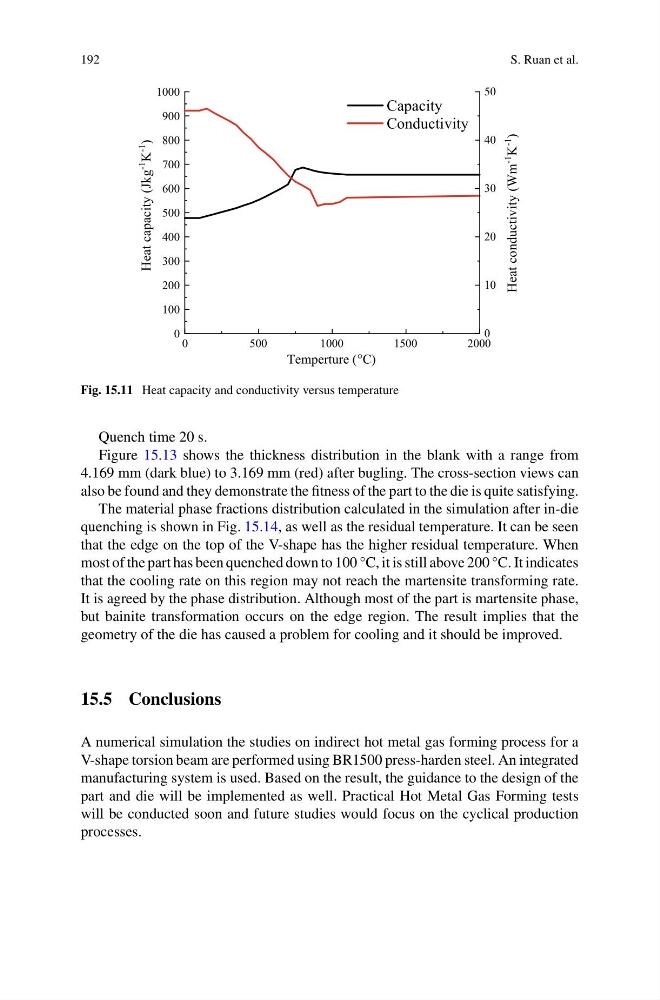
Fig. 15.11 Heat capacity and conductivity versus temperature
Quench time 20 s.
Figure 15.13 shows the thickness distribution in the blank with a range from
4.169 mm (dark blue) to 3.169 mm (red) after bugling. The cross-section views can
also be found and they demonstrate the fitness of the part to the die is quite satisfying.
The material phase fractions distribution calculated in the simulation after in-die
quenching is shown in Fig. 15.14, as well as the residual temperature. It can be seen
that the edge on the top of the V-shape has the higher residual temperature. When
most of the part has been quenched down to 100 °C, it is still above 200 °C. It indicates
that the cooling rate on this region may not reach the martensite transforming rate.
It is agreed by the phase distribution. Although most of the part is martensite phase,
but bainite transformation occurs on the edge region. The result implies that the
geometry of the die has caused a problem for cooling and it should be improved.
15.5 Conclusions
A numerical simulation the studies on indirect hot metal gas forming process for a
V-shape torsion beam are performed using BR1500 press-harden steel. An integrated
manufacturing system is used. Based on the result, the guidance to the design of the
part and die will be implemented as well. Practical Hot Metal Gas Forming tests
will be conducted soon and future studies would focus on the cyclical production
processes.
S. Ruan et al.
0
500
1000
1500
2000
0
100
200
300
400
500
600
700
800
900
1000
Heat capacity (Jkg
-1
K
-1
)
Temperture ( C)
Capacity
0
10
20
30
40
50
Conductivity
Heat
conductivity (Wm
-1
K
-1
)
Fig. 15.11 Heat capacity and conductivity versus temperature
Quench time 20 s.
Figure 15.13 shows the thickness distribution in the blank with a range from
4.169 mm (dark blue) to 3.169 mm (red) after bugling. The cross-section views can
also be found and they demonstrate the fitness of the part to the die is quite satisfying.
The material phase fractions distribution calculated in the simulation after in-die
quenching is shown in Fig. 15.14, as well as the residual temperature. It can be seen
that the edge on the top of the V-shape has the higher residual temperature. When
most of the part has been quenched down to 100 °C, it is still above 200 °C. It indicates
that the cooling rate on this region may not reach the martensite transforming rate.
It is agreed by the phase distribution. Although most of the part is martensite phase,
but bainite transformation occurs on the edge region. The result implies that the
geometry of the die has caused a problem for cooling and it should be improved.
15.5 Conclusions
A numerical simulation the studies on indirect hot metal gas forming process for a
V-shape torsion beam are performed using BR1500 press-harden steel. An integrated
manufacturing system is used. Based on the result, the guidance to the design of the
part and die will be implemented as well. Practical Hot Metal Gas Forming tests
will be conducted soon and future studies would focus on the cyclical production
processes.