

10 Tube Hydro-Forming Process Design Based …
123
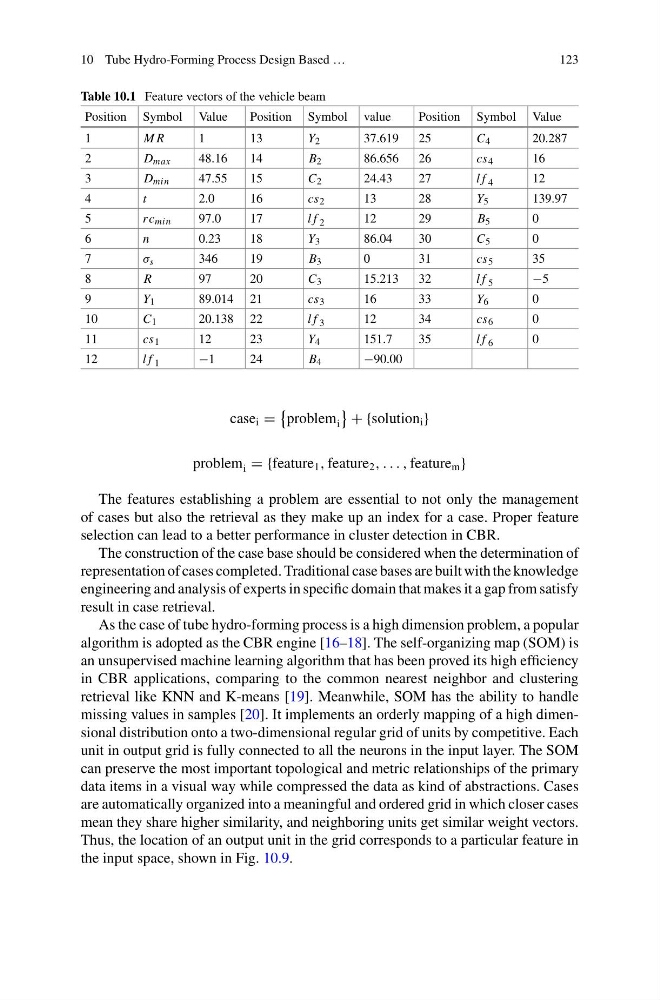
Table 10.1 Feature vectors of the vehicle beam
Position Symbol Value
Position Symbol value
Position Symbol Value
1
M R
1
13
Y 2
37.619
25
C 4
20.287
2
D max
48.16
14
B 2
86.656
26
cs 4
16
3
D min
47.55
15
C 2
24.43
27
l f 4
12
4
t
2.0
16
cs 2
13
28
Y 5
139.97
5
rc min
97.0
17
l f 2
12
29
B 5
0
6
n
0.23
18
Y 3
86.04
30
C 5
0
7
σ s
346
19
B 3
0
31
cs 5
35
8
R
97
20
C 3
15.213
32
l f 5
−5
9
Y 1
89.014 21
cs 3
16
33
Y 6
0
10
C 1
20.138 22
l f 3
12
34
cs 6
0
11
cs 1
12
23
Y 4
151.7
35
l f 6
0
12
l f 1
−1
24
B 4
−90.00
case i =
problem i
+ {solution i }
problem i = {feature 1 , feature 2 , . . . , feature m }
The features establishing a problem are essential to not only the management
of cases but also the retrieval as they make up an index for a case. Proper feature
selection can lead to a better performance in cluster detection in CBR.
The construction of the case base should be considered when the determination of
representation of cases completed. Traditional case bases are built with the knowledge
engineering and analysis of experts in specific domain that makes it a gap from satisfy
result in case retrieval.
As the case of tube hydro-forming process is a high dimension problem, a popular
algorithm is adopted as the CBR engine [16–18]. The self-organizing map (SOM) is
an unsupervised machine learning algorithm that has been proved its high efficiency
in CBR applications, comparing to the common nearest neighbor and clustering
retrieval like KNN and K-means [19]. Meanwhile, SOM has the ability to handle
missing values in samples [20]. It implements an orderly mapping of a high dimensional distribution onto a two-dimensional regular grid of units by competitive. Each
unit in output grid is fully connected to all the neurons in the input layer. The SOM
can preserve the most important topological and metric relationships of the primary
data items in a visual way while compressed the data as kind of abstractions. Cases
are automatically organized into a meaningful and ordered grid in which closer cases
mean they share higher similarity, and neighboring units get similar weight vectors.
Thus, the location of an output unit in the grid corresponds to a particular feature in
the input space, shown in Fig. 10.9.
123
Table 10.1 Feature vectors of the vehicle beam
Position Symbol Value
Position Symbol value
Position Symbol Value
1
M R
1
13
Y 2
37.619
25
C 4
20.287
2
D max
48.16
14
B 2
86.656
26
cs 4
16
3
D min
47.55
15
C 2
24.43
27
l f 4
12
4
t
2.0
16
cs 2
13
28
Y 5
139.97
5
rc min
97.0
17
l f 2
12
29
B 5
0
6
n
0.23
18
Y 3
86.04
30
C 5
0
7
σ s
346
19
B 3
0
31
cs 5
35
8
R
97
20
C 3
15.213
32
l f 5
−5
9
Y 1
89.014 21
cs 3
16
33
Y 6
0
10
C 1
20.138 22
l f 3
12
34
cs 6
0
11
cs 1
12
23
Y 4
151.7
35
l f 6
0
12
l f 1
−1
24
B 4
−90.00
case i =
problem i
+ {solution i }
problem i = {feature 1 , feature 2 , . . . , feature m }
The features establishing a problem are essential to not only the management
of cases but also the retrieval as they make up an index for a case. Proper feature
selection can lead to a better performance in cluster detection in CBR.
The construction of the case base should be considered when the determination of
representation of cases completed. Traditional case bases are built with the knowledge
engineering and analysis of experts in specific domain that makes it a gap from satisfy
result in case retrieval.
As the case of tube hydro-forming process is a high dimension problem, a popular
algorithm is adopted as the CBR engine [16–18]. The self-organizing map (SOM) is
an unsupervised machine learning algorithm that has been proved its high efficiency
in CBR applications, comparing to the common nearest neighbor and clustering
retrieval like KNN and K-means [19]. Meanwhile, SOM has the ability to handle
missing values in samples [20]. It implements an orderly mapping of a high dimensional distribution onto a two-dimensional regular grid of units by competitive. Each
unit in output grid is fully connected to all the neurons in the input layer. The SOM
can preserve the most important topological and metric relationships of the primary
data items in a visual way while compressed the data as kind of abstractions. Cases
are automatically organized into a meaningful and ordered grid in which closer cases
mean they share higher similarity, and neighboring units get similar weight vectors.
Thus, the location of an output unit in the grid corresponds to a particular feature in
the input space, shown in Fig. 10.9.