

2.5 Basics of Component Modeling in WSM
79
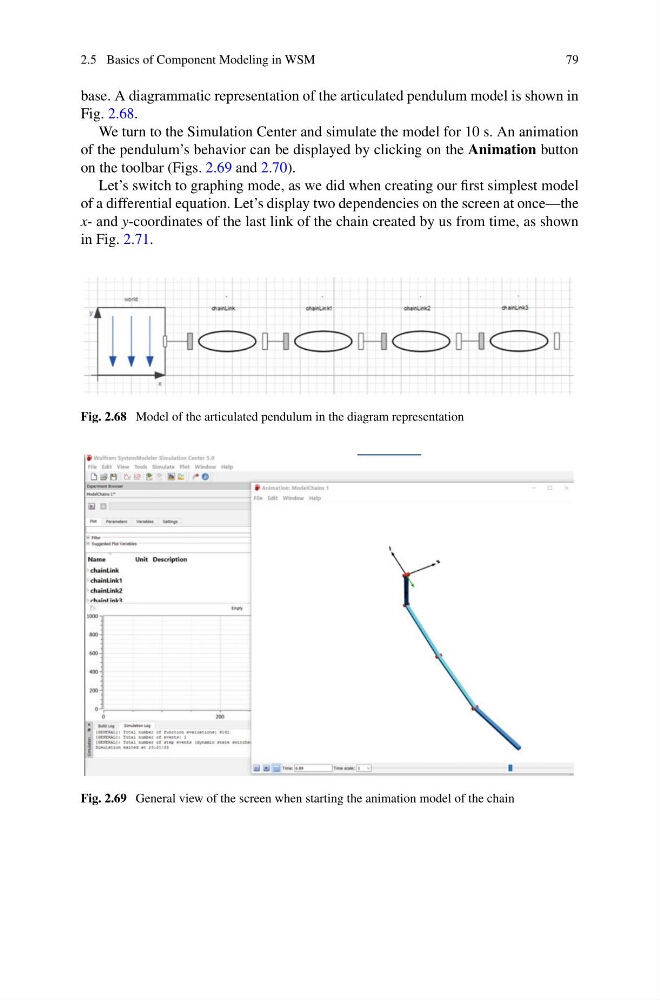
base. A diagrammatic representation of the articulated pendulum model is shown in
Fig. 2.68.
We turn to the Simulation Center and simulate the model for 10 s. An animation
of the pendulum’s behavior can be displayed by clicking on the Animation button
on the toolbar (Figs. 2.69 and 2.70).
Let’s switch to graphing mode, as we did when creating our first simplest model
of a differential equation. Let’s display two dependencies on the screen at once—the
x- and y-coordinates of the last link of the chain created by us from time, as shown
in Fig. 2.71.
Fig. 2.68 Model of the articulated pendulum in the diagram representation
Fig. 2.69 General view of the screen when starting the animation model of the chain
79
base. A diagrammatic representation of the articulated pendulum model is shown in
Fig. 2.68.
We turn to the Simulation Center and simulate the model for 10 s. An animation
of the pendulum’s behavior can be displayed by clicking on the Animation button
on the toolbar (Figs. 2.69 and 2.70).
Let’s switch to graphing mode, as we did when creating our first simplest model
of a differential equation. Let’s display two dependencies on the screen at once—the
x- and y-coordinates of the last link of the chain created by us from time, as shown
in Fig. 2.71.
Fig. 2.68 Model of the articulated pendulum in the diagram representation
Fig. 2.69 General view of the screen when starting the animation model of the chain