

6.1 Draining of a Tank
227
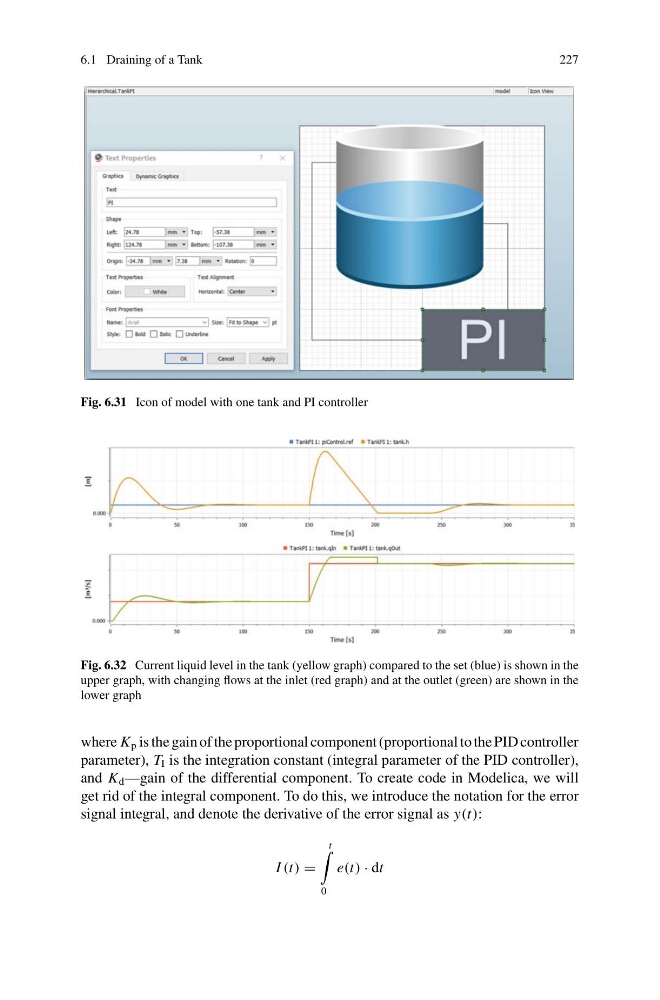
Fig. 6.31 Icon of model with one tank and PI controller
Fig. 6.32 Current liquid level in the tank (yellow graph) compared to the set (blue) is shown in the
upper graph, with changing flows at the inlet (red graph) and at the outlet (green) are shown in the
lower graph
where K p is the gain of the proportional component (proportional to the PID controller
parameter), T I is the integration constant (integral parameter of the PID controller),
and K d —gain of the differential component. To create code in Modelica, we will
get rid of the integral component. To do this, we introduce the notation for the error
signal integral, and denote the derivative of the error signal as y(t):
I (t) =
t
0
e(t) · dt
227
Fig. 6.31 Icon of model with one tank and PI controller
Fig. 6.32 Current liquid level in the tank (yellow graph) compared to the set (blue) is shown in the
upper graph, with changing flows at the inlet (red graph) and at the outlet (green) are shown in the
lower graph
where K p is the gain of the proportional component (proportional to the PID controller
parameter), T I is the integration constant (integral parameter of the PID controller),
and K d —gain of the differential component. To create code in Modelica, we will
get rid of the integral component. To do this, we introduce the notation for the error
signal integral, and denote the derivative of the error signal as y(t):
I (t) =
t
0
e(t) · dt