

5.7 Gear Rotary Mechanical System
189
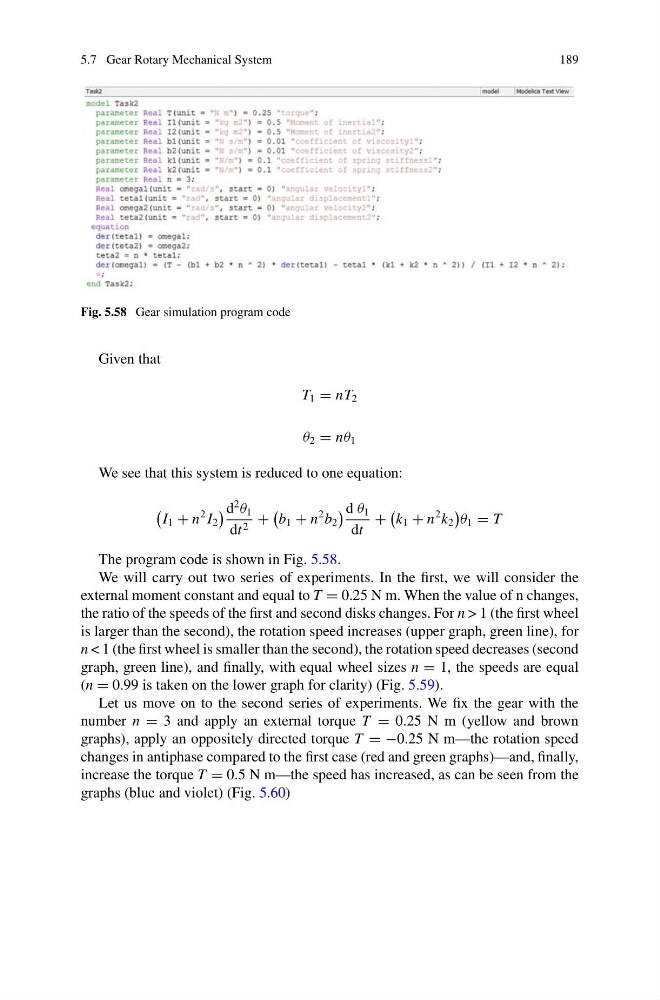
Fig. 5.58 Gear simulation program code
Given that
T 1 = nT 2
θ 2 = nθ 1
We see that this system is reduced to one equation:
I 1 + n
2 I 2
d
2
θ 1
dt 2 +
b 1 + n
2 b 2
d θ 1
dt
+
k 1 + n
2 k 2
θ 1 = T
The program code is shown in Fig. 5.58.
We will carry out two series of experiments. In the first, we will consider the
external moment constant and equal to T = 0.25 N m. When the value of n changes,
the ratio of the speeds of the first and second disks changes. For n > 1 (the first wheel
is larger than the second), the rotation speed increases (upper graph, green line), for
n < 1 (the first wheel is smaller than the second), the rotation speed decreases (second
graph, green line), and finally, with equal wheel sizes n = 1, the speeds are equal
(n = 0.99 is taken on the lower graph for clarity) (Fig. 5.59).
Let us move on to the second series of experiments. We fix the gear with the
number n = 3 and apply an external torque T = 0.25 N m (yellow and brown
graphs), apply an oppositely directed torque T = −0.25 N m—the rotation speed
changes in antiphase compared to the first case (red and green graphs)—and, finally,
increase the torque T = 0.5 N m—the speed has increased, as can be seen from the
graphs (blue and violet) (Fig. 5.60)
189
Fig. 5.58 Gear simulation program code
Given that
T 1 = nT 2
θ 2 = nθ 1
We see that this system is reduced to one equation:
I 1 + n
2 I 2
d
2
θ 1
dt 2 +
b 1 + n
2 b 2
d θ 1
dt
+
k 1 + n
2 k 2
θ 1 = T
The program code is shown in Fig. 5.58.
We will carry out two series of experiments. In the first, we will consider the
external moment constant and equal to T = 0.25 N m. When the value of n changes,
the ratio of the speeds of the first and second disks changes. For n > 1 (the first wheel
is larger than the second), the rotation speed increases (upper graph, green line), for
n < 1 (the first wheel is smaller than the second), the rotation speed decreases (second
graph, green line), and finally, with equal wheel sizes n = 1, the speeds are equal
(n = 0.99 is taken on the lower graph for clarity) (Fig. 5.59).
Let us move on to the second series of experiments. We fix the gear with the
number n = 3 and apply an external torque T = 0.25 N m (yellow and brown
graphs), apply an oppositely directed torque T = −0.25 N m—the rotation speed
changes in antiphase compared to the first case (red and green graphs)—and, finally,
increase the torque T = 0.5 N m—the speed has increased, as can be seen from the
graphs (blue and violet) (Fig. 5.60)