

164
5 Modeling of Mechanical Oscillatory Systems …
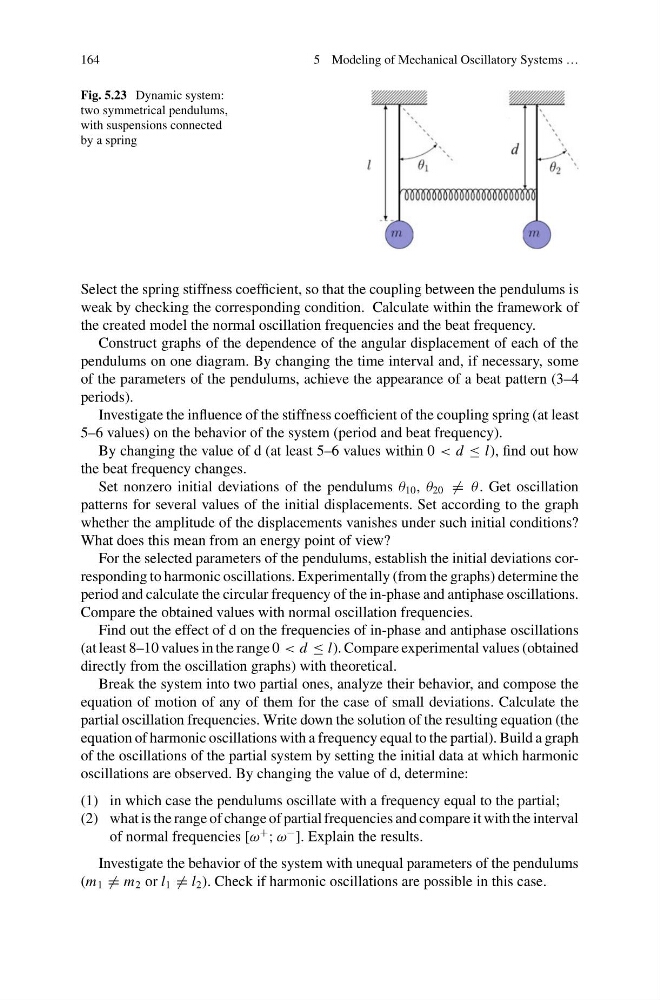
Fig. 5.23 Dynamic system:
two symmetrical pendulums,
with suspensions connected
by a spring
Select the spring stiffness coefficient, so that the coupling between the pendulums is
weak by checking the corresponding condition. Calculate within the framework of
the created model the normal oscillation frequencies and the beat frequency.
Construct graphs of the dependence of the angular displacement of each of the
pendulums on one diagram. By changing the time interval and, if necessary, some
of the parameters of the pendulums, achieve the appearance of a beat pattern (3–4
periods).
Investigate the influence of the stiffness coefficient of the coupling spring (at least
5–6 values) on the behavior of the system (period and beat frequency).
By changing the value of d (at least 5–6 values within 0 < d ≤ l), find out how
the beat frequency changes.
Set nonzero initial deviations of the pendulums θ 10 , θ 20 = θ . Get oscillation
patterns for several values of the initial displacements. Set according to the graph
whether the amplitude of the displacements vanishes under such initial conditions?
What does this mean from an energy point of view?
For the selected parameters of the pendulums, establish the initial deviations corresponding to harmonic oscillations. Experimentally (from the graphs) determine the
period and calculate the circular frequency of the in-phase and antiphase oscillations.
Compare the obtained values with normal oscillation frequencies.
Find out the effect of d on the frequencies of in-phase and antiphase oscillations
(at least 8–10 values in the range 0 < d ≤ l). Compare experimental values (obtained
directly from the oscillation graphs) with theoretical.
Break the system into two partial ones, analyze their behavior, and compose the
equation of motion of any of them for the case of small deviations. Calculate the
partial oscillation frequencies. Write down the solution of the resulting equation (the
equation of harmonic oscillations with a frequency equal to the partial). Build a graph
of the oscillations of the partial system by setting the initial data at which harmonic
oscillations are observed. By changing the value of d, determine:
(1) in which case the pendulums oscillate with a frequency equal to the partial;
(2) what is the range of change of partial frequencies and compare it with the interval
of normal frequencies [ω
+
; ω
−
]. Explain the results.
Investigate the behavior of the system with unequal parameters of the pendulums
(m 1 = m 2 or l 1 = l 2 ). Check if harmonic oscillations are possible in this case.
5 Modeling of Mechanical Oscillatory Systems …
Fig. 5.23 Dynamic system:
two symmetrical pendulums,
with suspensions connected
by a spring
Select the spring stiffness coefficient, so that the coupling between the pendulums is
weak by checking the corresponding condition. Calculate within the framework of
the created model the normal oscillation frequencies and the beat frequency.
Construct graphs of the dependence of the angular displacement of each of the
pendulums on one diagram. By changing the time interval and, if necessary, some
of the parameters of the pendulums, achieve the appearance of a beat pattern (3–4
periods).
Investigate the influence of the stiffness coefficient of the coupling spring (at least
5–6 values) on the behavior of the system (period and beat frequency).
By changing the value of d (at least 5–6 values within 0 < d ≤ l), find out how
the beat frequency changes.
Set nonzero initial deviations of the pendulums θ 10 , θ 20 = θ . Get oscillation
patterns for several values of the initial displacements. Set according to the graph
whether the amplitude of the displacements vanishes under such initial conditions?
What does this mean from an energy point of view?
For the selected parameters of the pendulums, establish the initial deviations corresponding to harmonic oscillations. Experimentally (from the graphs) determine the
period and calculate the circular frequency of the in-phase and antiphase oscillations.
Compare the obtained values with normal oscillation frequencies.
Find out the effect of d on the frequencies of in-phase and antiphase oscillations
(at least 8–10 values in the range 0 < d ≤ l). Compare experimental values (obtained
directly from the oscillation graphs) with theoretical.
Break the system into two partial ones, analyze their behavior, and compose the
equation of motion of any of them for the case of small deviations. Calculate the
partial oscillation frequencies. Write down the solution of the resulting equation (the
equation of harmonic oscillations with a frequency equal to the partial). Build a graph
of the oscillations of the partial system by setting the initial data at which harmonic
oscillations are observed. By changing the value of d, determine:
(1) in which case the pendulums oscillate with a frequency equal to the partial;
(2) what is the range of change of partial frequencies and compare it with the interval
of normal frequencies [ω
+
; ω
−
]. Explain the results.
Investigate the behavior of the system with unequal parameters of the pendulums
(m 1 = m 2 or l 1 = l 2 ). Check if harmonic oscillations are possible in this case.