

136
4 Modeling of Mechanical Oscillatory Systems with One Degree …
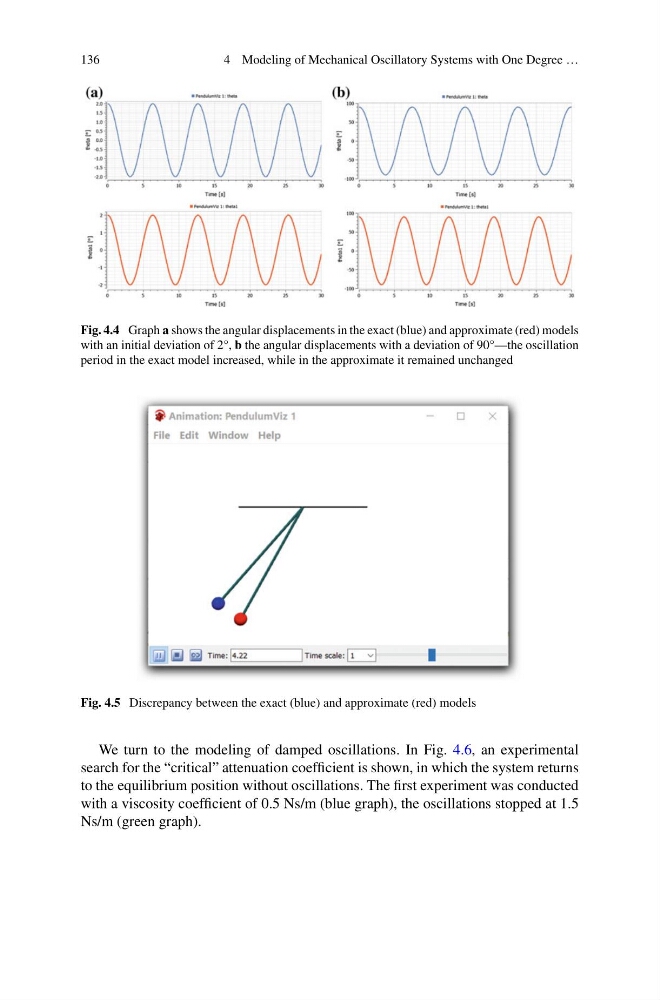
Fig. 4.4 Graph a shows the angular displacements in the exact (blue) and approximate (red) models
with an initial deviation of 2°, b the angular displacements with a deviation of 90°—the oscillation
period in the exact model increased, while in the approximate it remained unchanged
Fig. 4.5 Discrepancy between the exact (blue) and approximate (red) models
We turn to the modeling of damped oscillations. In Fig. 4.6, an experimental
search for the “critical” attenuation coefficient is shown, in which the system returns
to the equilibrium position without oscillations. The first experiment was conducted
with a viscosity coefficient of 0.5 Ns/m (blue graph), the oscillations stopped at 1.5
Ns/m (green graph).
4 Modeling of Mechanical Oscillatory Systems with One Degree …
Fig. 4.4 Graph a shows the angular displacements in the exact (blue) and approximate (red) models
with an initial deviation of 2°, b the angular displacements with a deviation of 90°—the oscillation
period in the exact model increased, while in the approximate it remained unchanged
Fig. 4.5 Discrepancy between the exact (blue) and approximate (red) models
We turn to the modeling of damped oscillations. In Fig. 4.6, an experimental
search for the “critical” attenuation coefficient is shown, in which the system returns
to the equilibrium position without oscillations. The first experiment was conducted
with a viscosity coefficient of 0.5 Ns/m (blue graph), the oscillations stopped at 1.5
Ns/m (green graph).