

102
3 Computer Simulation of Dynamic Systems
The total energy at the highest point should be equal to the potential change (since
we are looking for such an initial speed at which the pendulum stops at the highest
point), i.e.,
E = E p = 2mg2l = 4mgl
Equating the obtained expressions, we find the initial value for the angular velocity
corresponding to the transition trajectory:
ω 0 = 2
g
l
= 2
9.81
1
≈ 6.264 rad/s.
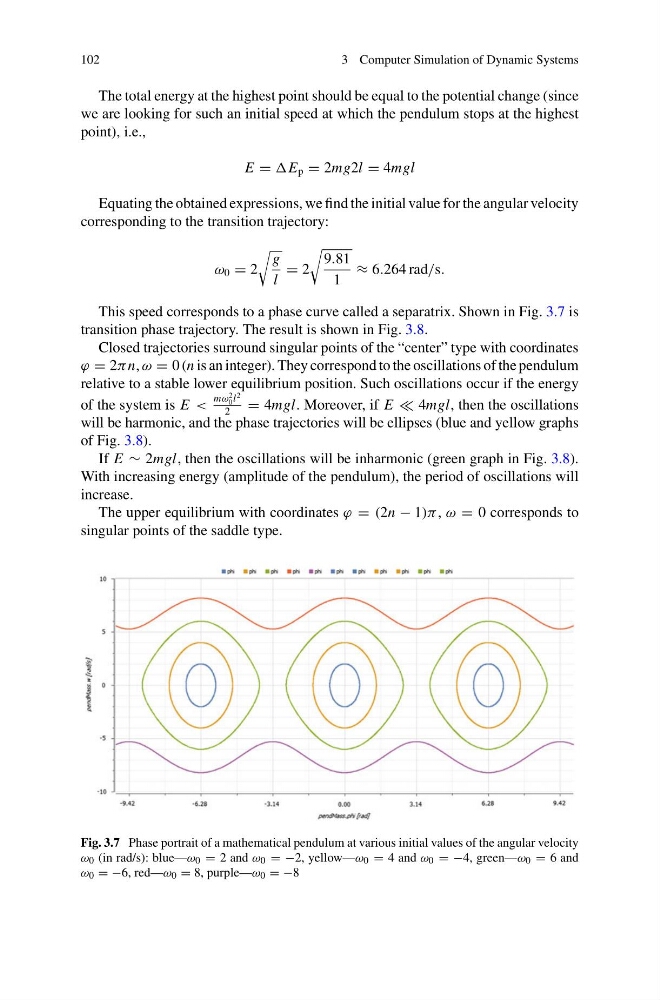
This speed corresponds to a phase curve called a separatrix. Shown in Fig. 3.7 is
transition phase trajectory. The result is shown in Fig. 3.8.
Closed trajectories surround singular points of the “center” type with coordinates
ϕ = 2π n, ω = 0 (n is an integer). They correspond to the oscillations of the pendulum
relative to a stable lower equilibrium position. Such oscillations occur if the energy
of the system is E <
mω
2
0 l
2
2
= 4mgl. Moreover, if E 4mgl, then the oscillations
will be harmonic, and the phase trajectories will be ellipses (blue and yellow graphs
of Fig. 3.8).
If E ∼ 2mgl, then the oscillations will be inharmonic (green graph in Fig. 3.8).
With increasing energy (amplitude of the pendulum), the period of oscillations will
increase.
The upper equilibrium with coordinates ϕ = (2n − 1)π , ω = 0 corresponds to
singular points of the saddle type.
Fig. 3.7 Phase portrait of a mathematical pendulum at various initial values of the angular velocity
ω 0 (in rad/s): blue—ω 0 = 2 and ω 0 = −2, yellow—ω 0 = 4 and ω 0 = −4, green—ω 0 = 6 and
ω 0 = −6, red—ω 0 = 8, purple—ω 0 = −8
3 Computer Simulation of Dynamic Systems
The total energy at the highest point should be equal to the potential change (since
we are looking for such an initial speed at which the pendulum stops at the highest
point), i.e.,
E = E p = 2mg2l = 4mgl
Equating the obtained expressions, we find the initial value for the angular velocity
corresponding to the transition trajectory:
ω 0 = 2
g
l
= 2
9.81
1
≈ 6.264 rad/s.
This speed corresponds to a phase curve called a separatrix. Shown in Fig. 3.7 is
transition phase trajectory. The result is shown in Fig. 3.8.
Closed trajectories surround singular points of the “center” type with coordinates
ϕ = 2π n, ω = 0 (n is an integer). They correspond to the oscillations of the pendulum
relative to a stable lower equilibrium position. Such oscillations occur if the energy
of the system is E <
mω
2
0 l
2
2
= 4mgl. Moreover, if E 4mgl, then the oscillations
will be harmonic, and the phase trajectories will be ellipses (blue and yellow graphs
of Fig. 3.8).
If E ∼ 2mgl, then the oscillations will be inharmonic (green graph in Fig. 3.8).
With increasing energy (amplitude of the pendulum), the period of oscillations will
increase.
The upper equilibrium with coordinates ϕ = (2n − 1)π , ω = 0 corresponds to
singular points of the saddle type.
Fig. 3.7 Phase portrait of a mathematical pendulum at various initial values of the angular velocity
ω 0 (in rad/s): blue—ω 0 = 2 and ω 0 = −2, yellow—ω 0 = 4 and ω 0 = −4, green—ω 0 = 6 and
ω 0 = −6, red—ω 0 = 8, purple—ω 0 = −8