

216
7 Nanomaterials for Supercapacitors
7.4.3 Na-Ion Hybrid Capacitor
It is demonstrated that the MXene Ti 2 C nanosheet electrode could achieve a higher
specific capacity in comparison to double-layer capacitor electrodes. To further verify
the potential of Ti 2 CT x in Na-ion hybrid capacitors, the prototype Na-ion hybrid
capacitor consisting of an alluaudite Na 2 Fe 2 (SO 4 ) 3 positive electrode and a Ti 2 C
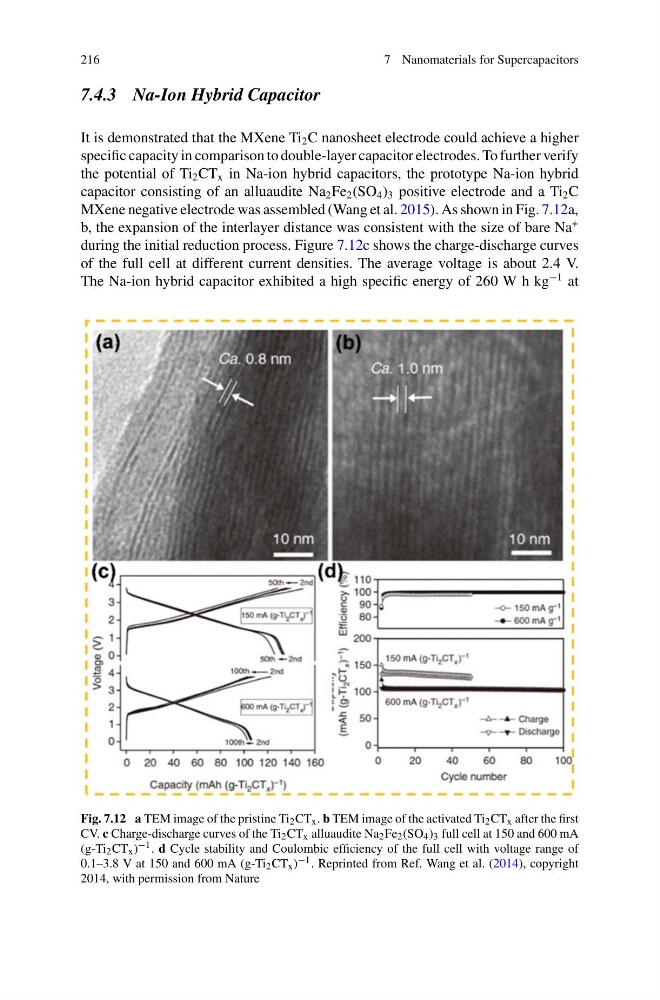
MXene negative electrode was assembled (Wang et al. 2015). As shown in Fig. 7.12a,
b, the expansion of the interlayer distance was consistent with the size of bare Na
+
during the initial reduction process. Figure 7.12c shows the charge-discharge curves
of the full cell at different current densities. The average voltage is about 2.4 V.
The Na-ion hybrid capacitor exhibited a high specific energy of 260 W h kg
−1 at
Fig. 7.12 a TEM image of the pristine Ti 2 CT x . b TEM image of the activated Ti 2 CT x after the first
CV. c Charge-discharge curves of the Ti 2 CT x alluaudite Na 2 Fe 2 (SO 4 ) 3 full cell at 150 and 600 mA
(g-Ti 2 CT x ) −1 . d Cycle stability and Coulombic efficiency of the full cell with voltage range of
0.1–3.8 V at 150 and 600 mA (g-Ti 2 CT x ) −1 . Reprinted from Ref. Wang et al. (2014), copyright
2014, with permission from Nature
7 Nanomaterials for Supercapacitors
7.4.3 Na-Ion Hybrid Capacitor
It is demonstrated that the MXene Ti 2 C nanosheet electrode could achieve a higher
specific capacity in comparison to double-layer capacitor electrodes. To further verify
the potential of Ti 2 CT x in Na-ion hybrid capacitors, the prototype Na-ion hybrid
capacitor consisting of an alluaudite Na 2 Fe 2 (SO 4 ) 3 positive electrode and a Ti 2 C
MXene negative electrode was assembled (Wang et al. 2015). As shown in Fig. 7.12a,
b, the expansion of the interlayer distance was consistent with the size of bare Na
+
during the initial reduction process. Figure 7.12c shows the charge-discharge curves
of the full cell at different current densities. The average voltage is about 2.4 V.
The Na-ion hybrid capacitor exhibited a high specific energy of 260 W h kg
−1 at
Fig. 7.12 a TEM image of the pristine Ti 2 CT x . b TEM image of the activated Ti 2 CT x after the first
CV. c Charge-discharge curves of the Ti 2 CT x alluaudite Na 2 Fe 2 (SO 4 ) 3 full cell at 150 and 600 mA
(g-Ti 2 CT x ) −1 . d Cycle stability and Coulombic efficiency of the full cell with voltage range of
0.1–3.8 V at 150 and 600 mA (g-Ti 2 CT x ) −1 . Reprinted from Ref. Wang et al. (2014), copyright
2014, with permission from Nature